- Research
- Open access
- Published:
A systematic process for obtaining the behavior of context-sensitive systems
Journal of Software Engineering Research and Development volume 4, Article number: 2 (2016)
Abstract
Background
Context-sensitive systems use contextual information in order to adapt to the user’s current needs or requirements failure. Therefore, they need to dynamically adapt their behavior. It is of paramount importance to specify and analyze the intended behavior of these systems before they are fully implemented. The behavioral specification can be used for requirements validation in order to check if these systems will be able to achieve their goals. Moreover, the reasoning about properties of these systems, such as deadlocks, reachability, completeness and correctness of the system, can be supported. Therefore, it is of paramount importance to have an approach to specify the dynamic behavior of the context-sensitive systems.
In this work, we propose the GO2S (GOals to Statecharts) process to systematically derive the behavior of context-sensitive systems, expressed as statecharts, from requirements models, described as goal models.
Results
The GO2S process addresses the specification of the tasks required for monitoring of requirements satisfaction as well as the system adaptation according to the context, the operationalization of non-functional requirements and prioritization of alternatives to be used at runtime (variants). It is an iterative process centered on the incremental refinement of a goal model, obtaining different views of the system (design, contextual, behavioral). Furthermore, we conducted a controlled experiment to evaluate the statecharts produced following GO2S process (experimental group) in relation to the ones elaborated in ad-hoc fashion (control group).
Conclusions
The experiment results showed that the structural complexity of the statecharts of the experimental group was lower in relation to the control group. Moreover, the average of functionalities whose behavior was modeled according to the specification and the time spent to produce the models of the experimental group were higher in relation to the control group. Besides, the subjects agreed that the GO2S process is easy to use.
1 Introduction
In this section, we characterize the context of this work and the main motivations and justifications for conducting it. Then, we present the research goals and a brief summary of the contributions of this work. Finally, the work structure is defined.
1.1 Context
Requirements Engineering (RE) is a branch of Software Engineering (SE) that deals with elicitation, refinement, analysis, of software systems requirements (Sommerville and Kotonya 1998). Therefore, it addresses the reasons why a software system is needed, the functionalities it must have to achieve, its purpose and the constraints on how the software must be designed and implemented (Lapouchnian 2005).
Goal-oriented Requirements Engineering (GORE) approaches have become quite popular. GORE is concerned with the use of goals for eliciting, elaborating, structuring, specifying, analyzing, negotiating, documenting, and modifying requirements (Lapouchnian 2005).
Goal models have been used as an effective means to capture the interactions and information-related requirements of adaptive systems and context-sensitive systems (Ali et al. 2010; Penserini et al. 2007; Morandini et al. 2009; Pimentel et al. 2014). A possible reason is that they incorporate the space of alternatives of a set of operations, i.e. variants, which gives more flexibility to meet stakeholders’ goals in a dynamic environment (Ali et al. 2010).
The requirements models, which describe the problem, need to be related to the solution space, which often begins with the architectural description. However, a software architecture cannot be described in a simple one-dimensional fashion (Clements et al. 2002). It can be represented through different views: structural, behavioral, deployment, configuration, etc. In this work, we are concerned with the behavioral view.
Many notations support the description of the system’s behavior such as Labelled Transition Systems (LTS) (Nicola 1987), Petri Nets (Murata 1989), and Statechart (Harel 1987). Statechart, adopted by Unified Modeling Language (UML) language, is a popular choice for representing the behavioral view of a system (Pimentel et al. 2014; Ranjita et al. 2012). Besides, this notation is an interesting visual formalism for modeling context-sensitive systems since they are reactive and adapt their requirements.
Computer systems that use context to provide more relevant services or information are called Context-Sensitive Systes (CSS) (Abowd et al. 1999). CSS enable systems to distil available information into relevant information, to choose relevant actions from a list of possibilities, or to determine the optimal method of information delivery (Santos 2008).
An important feature of CSS is the contextual adaptation (Chalmers 2002). In these systems, context can be used to trigger actions (when a certain set of contextual information reaches specific values); or services (tailored according to the limits and preferences imposed by the context). Hence, these systems use context to direct actions and behaviors to support communication between systems and their users. This support can be achieved changing their sequence of actions, the style of interactions and the type of information provided to users in order to adapt to the user’s current needs or requirements failure (Vieira et al. 2011).
Since context-sensitive systems are flexible and capable of reacting on behalf of their users, they need to dynamically adapt their behavior. The are many benefits of specifying the behavior of context-sensitive systems (Clements et al. 2002): the models can be used as a communication channel among stakeholders during system-development activities and they improve the confidence that the context-sensitive system will be able to achieve its goals. Moreover, the reasoning about systems’ properties in the behavioral models, such as deadlocks, reachability, completeness and correctness of the system, can be supported.
1.2 Motivation and rationale
Enabling computer systems to change their behavior according to the analysis of contextual information is a challenge that attracts the attention of researchers from several areas of computer science (Ali et al. 2010; Santos 2008; Yu et al. 2008).
Context-sensitive systems must have the following characteristics: monitoring, awareness and adaptability (Klein et al. 2008). Hence, developing CSS is a complex and a labor-intensive task. When designing these systems, the software engineer needs to deal with issues associated to: which kind of information consider as context, how to represent this information, how to acquire and process it (considering that it may come from several and heterogeneous sources) and how to integrate the use of context in the system (Santos 2008).
However, software engineers have difficulties to understand and define what to consider as context and how to design context-sensitive systems. A possible reason is the lack of consensus in the literature regarding the terminology, characteristics and specificities related to context and CSS.
It is worth mentioning that context can influence the requirements of a system, and as a consequence, the choice of the variant (alternative to be executed at runtime) a system can adopt to meet its requirements (Ali et al. 2010). Hence, there is a need for approaches that guide CSS designers on obtaining their behavior and performing activities related to the system’s behavior specification.
It is important to note that Non-Functional Requirements (NFR) affect both the structural and behavioral aspects of the system (Liu et al. 2010). Hence, they need to be operationalized. Moreover, they should be taken in consideration when deciding which variant is more appropriate in a given context. Therefore, NFRs are critical and must be elicited, analyzed, and properly handled.
Software-development organizations frequently begin their activities with one of these alternative starting points - requirements or architectures - often adopting a waterfall like development process. It is common to artificially freeze the requirements document and release it for use in the next step of the development life cycle. On the other hand, if the development is based on constrained architectures, it may restrict users and handicap developers by resisting inevitable and desirable changes in requirements.
In fact, it is well known that requirements and software architecture are intertwined (Nuseibeh 2001). Hence, it is of paramount importance that the architecture should be aligned with requirements.
The inherent variability of CSS requires the analysis of their behavior before they are fully implemented. Therefore, we need approaches to guide the software engineer of CSS to obtain the behavior of context-sensitive systems from requirements models. To the best of our knowledge, no approach is available to guide the software engineer to perform this specification from requirements models.
In particular, we investigated the work of (Pimentel et al. 2014) related to the derivation of behavior from goal models. The authors assume that there is an uniform nature of the context in which the system operates. Unfortunately, this is not always the case.
The research described in this paper is targeted, especially, at designers of CSS, particularly those responsible for knowledge engineering, requirement analysis and architecture design. We envisage a Model-Driven Development (MDD) approach, where models play a key role throughout the development (Mellor et al. 2003).
1.3 Objectives
The main research question investigated by this work is: How can we obtain the behavior of context-sensitive systems from requirements models including their non-functional requirements?
In order to answer this research question, we define the following specific objectives:
-
Proposal of a systematic process for deriving the behavior of context-sensitive systems from requirements models;
-
Definition of a systematic approach for the specification of monitoring and adaptation tasks;
-
Illustration of the process applicability through an example;
-
Empirical evaluation of the process through a controlled experiment to evaluate the time to implement, syntactic correctness, structural complexity, behavioral similarity and cognitive complexity of the generated statecharts using (or not) our approach.
1.4 Contributions
The main contributions of this work consist in the proposal of: A systematic process for deriving the behavior of context-sensitive systems, expressed as statechart, from requirements models, specified as goal models; Specification of monitoring and adaptation tasks in a contextual design goal model; The behavioral contextual design goal model; A running example to demonstrate the process application; and A controlled experiment in order to evaluate our process. The contributions of this paper are discussed in more details in Section 5.1.
The remainder of this paper is organized as follows. In Section 2, we overview the research baseline for this work. In Section 3, we explain the GO2S process, and discuss its use with a running example. Section 4 presents the design and results of a controlled experiment we conducted to evaluate our process. Section 5 discusses the contributions of this work and points out some open issues. Later, we present related works in Section 6 while conclusions and venues for future works are presented in Section 7.
2 Background
The GO2S systematic process proposed in this paper consists of an incremental refinement of a goal model, towards a statechart of a context-sensitive system. Our process follows the twin peaks concept (Nuseibeh 2001) which separates problem structure and requirements specification from solution structure and architecture specification, producing progressively more detailed requirements and design specifications. The following sub-sections provide a brief overview of these concepts.
2.1 Context-sensitive systems
People use daily, contextual information to make decisions, make judgments or interact with others. Understanding the context in which there is a certain interaction is essential for individuals to respond appropriately to the situation. Accordingly, context is used in different types of interactions such as “Person-Person”, “Human-Computer” and “Computer-Computer” (Vieira et al. 2011).
Applications that use context to provide services and relevant information are called Context-Sensitive Systems. These systems must have the following characteristics: monitoring, awareness and adaptability (Klein et al. 2008). Accordingly, CSS are flexible, able to act autonomously on behalf of users and dynamically adapt their behavior.
Thus, CSS use context to direct actions and behaviors to support communication between systems and their users (Vieira et al. 2011). To provide this support can be used (Chalmers 2002): Contextual sensing, Contextual augmentation, Contextual resource discovery, Context triggered actions, and Contextual mediation. In our work, we are concerned with the last two cases Context triggered actions and Contextual mediation. They are two types of Contextual adaptation (Chalmers 2002) that are responsible for changing the sequence of actions, the style of interactions and the type of information provided to users in order to adapt to the user’s current needs or requirements failure (Vieira et al. 2011).
There is no consensus on the definition, terminology and related terms associated to context. (Bazire and Brézillon 2005) cataloged more than 150 definitions of the concept and concluded that there are many definitions for context that differs strongly across different domains (computer science, philosophy, economy, business, human computer interaction). As an example, in a context-sensitive search engine, if a user searches the term “java” that could mean a programming language or an island. To disambiguate the searched term, the engine may look to the context that can be the query history. If the user asked recently for any programming language such as Pascal, C++, PHP, then most probably he is looking for the Java programming language (Ali et al. 2010).
One possible explanation for this lack of consensus is that the context is used supposing that everybody knows its meaning. However, the definitions of context are too much dependent of their own contexts (e.g. the discipline in which the definition is taken but also on both the kind and the goal of a given text) (Bazire and Brézillon 2005).
In this work, we adopted the definition from the GORE perspective proposed by (Ali et al. 2010). They defined a framework that states that context is a partial state of the world that is relevant to an actor’s goals. Accordingly, each context must be refined to allow it to be checked. The contextual refinement has a tree-like structure (see Fig. 1) in which the root of this model is the context, and facts and statements are its nodes. In order to obtain a verifiable context, all statements are refined into sub-statements and facts, until there are only facts left.

Refinement of C4 context of meeting scheduler example
Facts are predicates which truth values can be verified in a context, i.e. the system can capture the necessary data and compute the truth value of a fact. For example, The meeting date is more than two days away. These facts are verifiable on the basis of data a system can collect of the world.
Statements, on the other hand, cannot be verified directly in a context due lack of information or its abstract nature. For example, The meeting is not urgent, is a subjective assertion that does not have a clear criteria to be evaluated against. A statement S is supported (through Support relation) by a set of facts that gives enough evidence to the truth of S. Hence, a statement is not monitorable by itself but it is an abstraction of visible facts.
Statements are represented as shadowed rectangles and facts as parallelograms (Ali et al. 2010). The support relation is represented as curved filled-in arrow, and the implication logical operators and, or are represented as black triangles, white triangles, filled-in arrows, respectively.
Figure 1 presents the refinement of the C4 context related to Collect timetables by email task of the meeting scheduler example. It will be true if The number of participants is high (since it will be time consuming calling too many participants), or The meeting is not urgent (which can be checked by the fact The meeting date is more than 2 days away). If it is urgent, the participants should be contacted by phone. Likewise, it is required that The participants usually answer meeting requests by email (i.e. The participants answered more than 50 % of timetables requests).
The context acts like a set of constraints that influence the behavior of a system embedded in a given task (Bazire and Brézillon 2005). Hence, context-sensitive systems must monitor the context at runtime in order to decide which action will be executed. Accordingly, in addition to the specification of the facts and statements that defines a context, it is necessary to specify the real-word properties of the facts that changes at runtime. These properties are called Contextual Elements (CE) (Vieira et al. 2011). These elements can be defined as data or information in the domain whose instantiated values influence the truth values of facts in the contextual refinements.
Each contextual element can be identified with respect to its frequency or periodicity and classified as static or dynamic. Static CE indicates information that is, in general, fixed or does not change very often (e.g. user’s personal data - date of birth, number of rooms in the meeting scheduler system). Dynamic CE changes almost instantly, hence it needs to be constantly monitored and updated (e.g. physical location of a person, participants available dates, number of date conflicts in a meeting request). The dynamic elements are important for the specification of the context monitoring as will be discussed in Section 3.
For systems operating in and reflecting varying contexts, it is important to specify the Context sources. These sources are mechanisms, such as equipments or technologies, necessary to install or to use in order to enable contextual data collection.
The design of CSS entails more work in comparison to systems that do not consider context since they must care for context-related tasks, such as the acquisition, processing, storage and presentation of contextual information. In the next section, we presented the goal-oriented approach for context modeling adopted in this paper.
2.2 Contextual goal model
GORE is concerned with the use of goals for eliciting, elaborating, structuring, specifying, analyzing, negotiating, documenting, and modifying requirements (Van Lamsweerde et al. 1995).
Goal models capture and refine stakeholder intentions to generate functional and non-functional requirements. The notation used in this paper is based on the one described by (Castro et al. 2002) which has goals, tasks, softgoals and contribution links (Make (++), Help (+), Hurt (-) and Break (–)).
A contextual goal model extends a goal model with context annotations in order to specify the variation points that are context-dependent. The notation used in this paper to represent contexts in goal models is based on (Ali et al. 2010). Thus, contexts in our work can be associated with the following variation points in a goal model:
-
Or-refinement: the adoptability of a subgoal (subtask) may require a specific context to hold as a pre-condition for the applicability of the corresponding goal model variant. For example, consider the or-refinement of Timetables Collected goal in Fig. 6. The Collect by email task will executed only if C4 holds, the same reasoning applies to the other tasks in this refinement.
-
And-refinement: the satisfaction (execution) of a subgoal (subtask) in this refinement is needed only in certain contexts. A subgoal/task in this refinement must be provided by its parent node but its execution is context-dependent. For example, consider the Manage performance adaptation task in Fig. 9. The meeting scheduler system must be able to perform this task, but it has not to be in all cases, only when the C7 context holds. Although this is syntactically equivalent to an or-refinement, the semantic is different. A context on an and-refinement influences the need for reaching or executing the corresponding subgoal/subtask, while a context on an or-refinement is itself needed to hold before adopting the corresponding subgoal/subtask. This semantic difference is essential to decide which requirements and alternatives will be active when a context change occurs at runtime.
-
Contribution to softgoals: softgoals can be contributed either positively or negatively by goals and tasks. The contribution of softgoals can vary from one context to another. For example, the Turn on air ventilator task contributes positively to Privacy softgoal and negatively to Energy spent wisely softgoal when C12 (it is sunny and not very windy) holds.
According the framework of (Ali et al. 2010), for each variation point in the goal model, the software engineer has to decide if a variation point is context-dependent or not. When a contextual variation point is identified, the variants at the goal model are labelled by C1…Cn and annotated in the model (see Fig. 6), and described as a sentence (see Table 2). Then, the contexts are refined in statements and facts to allow it to be checked.
2.3 Flow expressions
Flow expressions are an extension to regular expressions and can be used to describe the behavior of software architectures through its goals and tasks in a goal model. Accordingly, flow expressions are an useful notation that can aid in the design, analysis, and understanding of software systems (Shaw 1978).
We adopted the symbols proposed by (Pimentel et al. 2014), described in Table 1, with the purpose of facilitating their writing. Each atomic symbol represents a state related to an element of the goal model. For example, if t1 is a task, the atomic expression Ti represents the state where t1 is being fulfilled.
Flow expressions can be composed in terms of regular expression operators, such as concatenation (t1 t2), meaning first satisfy t1 then t2 (sequential flow), or t2*, meaning that t2 is to be satisfied zero or more times. Flow expressions separated with a vertical bar |symbol represent alternative flows. The question mark ? is used to represent the optionality of the flow to its left, i.e., that flow may be executed zero or one times.
The star symbol * indicates that the flow to its left may be executed zero, one or more times, while the plus symbol + indicates that the flow may be executed one or more times. A dash - indicates that two flows are to be carried out concurrently, in the sense that their states can be interleaved. These expressions allow the representation of the system behavior as annotations on a goal model. Table 1 presents each symbol, its meaning and an example.
As an example of flow expressions, consider the following flow expression: (A B (C |D) E F* G) - (H*). This expression indicates that state A is followed by state B. After B, the possible states are C or D (exclusively), followed by E. After E, F may be reached any number of times. State G occurs after E or after F. Concurrently to all that, the state H may occur any number of times.
2.4 Statecharts
Statecharts (Harel 1987) extend conventional state-transition diagrams with essentially three elements, dealing, respectively, with the notions of hierarchy, concurrency and communication.
Statecharts can be used as a stand-alone behavioral description, and, therefore, became a popular visual formalism for modeling reactive systems (Harel 1987) such as context-sensitive systems. These systems are characterized by being, to a large extent, event-driven, continuously having to react to external and internal stimuli such as context-sensitive systems.
The main elements of statecharts are states, events, transitions, actions and regions. States are conditions during the life of an object or an interaction during which it satisfies some condition, performs some action, or waits for some event.
Transitions capture a change of state caused by the occurrence of some associated event. A transition may be guarded by some condition, represented by a condition name or an expression enclosed between brackets. A guard captures a necessary condition for transition firing. States are represented as boxes and transitions between states represented as arrows.
An action is an auxiliary operation associated with a state transition that is applied when the transition is activated. Statecharts also support the nesting of states. Concurrency is represented by dividing a composite state into regions that are shown separated by dotted lines.
Developing CSS is a complex and a labor-intensive task. Hence, there is a need for approaches that guide CSS designers on obtaining their behavior from requirements models and performing activities related to the system’s behavior specification. In the next Section, we present the GO2S process - a systematic process to derive the behavior of context-sensitive system from requirements models.
3 GOals to Statecharts (GO2S) process
Processes provide activities that support an activity. They can be used as checklists and guidelines of what to do and how to do it (Wohlin et al. 2012). In order to develop context-sensitive systems, several activities to obtain their behavior have to be taken.
In this work, we propose the GO2S process to systematically derive the behavior of context-sensitive systems (modeled as statecharts), from system’s requirements (modeled as goal models) following the twin peaks concept (Nuseibeh 2001). The steps of the GO2S process are illustrated in Fig. 2.

The GO2S process for deriving the behavior of context-sensitive systems
In order to specify the GO2S process, we used the Business Process Modeling Notation (BPMN) (OMG 2016). BPMN is a well-adopted process-modeling standard supported by many software tools that provides a graphical notation that describes the flow of a process. Since this notation has been specifically designed to coordinate the sequence of processes and the messages that flow between different process participants in a related set of activities, it facilitates the understanding of the procedures and ensure that software engineers understand themselves (OMG 2016).
GO2S is divided into the following main sub-processes (see Fig. 2): the first sub-process concerns the construction of Design Goal Model (DGM). It is followed by the specification of contextual variation points. In the third sub-process, the tasks required for the monitoring and adaptation activities are specified. Later, in the fourth sub-process, the system behavior is represented in flow expressions. The next one derives a statechart from the behavioral contextual design goal model. Finally, the last sub-process is the prioritization of variants.
We explored the idea that it is possible to modularize the development of CSS by organizing the GO2S process in six sub-processes considering the main activities in order to develop a context-sensitive system. The process is not supposed to be a waterfall model. Thus, it is not assumed that a sub-process must be totally finished before the next one is started. This is an iterative process centered on the incremental refinement of a goal model, obtaining different views of the system (design, contextual, behavioral). Accordingly, it may be necessary to go back and forth in the activities until the desired level of detail is reached.
The sub-processes of GO2S process are illustrated in Fig. 2, and further elaborated in the following sub-sections. At the beginning of each sub-process, we present a summary of its goal, inputs, activities, and outputs.
3.1 Sub-process 1: Construction of design goal model
-
Goal: Refine a goal model with new design elements
-
Input: A goal model
-
Activities:
1: Identify design tasks and constraints
2: Perform the NFR analysis
3: Include the design tasks that operationalizes the NFRs in the goal model
4: Assign Tasks
-
Outputs:
Design Goal Model
Operationalization of NFRs
Our overall objective is to obtain the behavior of context-sensitive systems. Thus, we assume that requirements elicitation and analysis activities were previously performed and a goal model was generated. Hence, the first sub-process (see Fig. 3) of our process consists of Construction of Design Goal model and receives a goal model as an input.

Activities of Construction of Design goal model activity
As we move to the solution space, it can be necessary to include new elements that appeared in the design phase, such as design tasks and design constraints (Pimentel et al. 2014). Design tasks allow the architect to model tasks that, although not relevant for the stakeholders in a first moment, are important for the definition of the system’s behavior. Note these concerns usually emerge after requirements elicitation. Design quality constraints, on the other hand, restrict the initial goals and tasks or define requirements quality constraints into more concrete ones (Pimentel et al. 2014).
Accordingly, these new elements are represented through dashed borders in a goal model. This differentiation is used to emphasize the phase of the software development they appear, while requirements elements describe the stakeholders’ needs, design ones express a possible way to fulfil those needs. Despite such differentiation, these elements have the same semantic of tasks and quality constraints in a goal model. Therefore, by including these elements in a goal model, it is possible to make use of the existing goal reasoning infrastructure when designing systems with specific needs like context-sensitivity.
In the first activity of the sub-process, the software engineer should check if there is critical design task or quality constraint that was not identified in the requirements phase that is necessary to the system. One source of these elements are NFRs. Therefore, it is important to consider their impact in the system, since they change or complement both the structural and behavioral aspects of the system architecture (Liu et al. 2010).
Therefore, note that in this first sub-process, we can establish the relationship between NFR and the goal model using techniques for NFR analysis such as Softgoal Interdependency Graph (SIG) (Chung et al. 2012). If a NFR needs to be operationalized, a design task must be included in the goal model. Further, design constraints may also need to be included.
Moreover, the design goal model also allows the definition of assignments for its tasks. A task or design task may be assigned/delegated to one or more users. Assignments are expressed by labels below the assigned element (Pimentel et al. 2014). The left side of the label shows the icon of a person, to represent the assignment. The users to whom the task was assigned to are listed to the right of the icon, as shown in Fig. 4.

DGM of meeting scheduler example adapted from (Angelopoulos et al. 2014)
In the meeting scheduler system, we have the usability, performance and security NFR. In order to satisfy the security NFR, it was decided to perform access management, so a new functionality should be added to satisfy this requirement. This is expressed by the Manage Access design task. Besides, the Contact Participants design task may be performed either by the meeting organizer or by a secretary.
This assignment was chosen since developing the capability of making automatic phone calls and collecting timetables would be too costly. In order to make this kind of decision, it may be necessary to consult with the project stakeholders in order to find the most beneficial option. The DGM of the meeting scheduler which encompasses both requirements and design elements, is shown in Fig. 4.
The outputs of this sub-process is the DGM which can include the design tasks that operationalizes the NFRs. The OR refinement of DGM introduces alternatives into the model accommodating many/all possible functionalities that fulfil stakeholder goals. The space of alternatives defined by a goal model can be used as a basis for designing fine-grained variability for highly customizable or adaptable software (Yu et al. 2008). Hence, we need to consider variability of the model (Ali et al. 2010) as described in next sub-process.
3.2 Sub-process 2: Specification of contextual variation points
-
Goal: Refine a design goal model with contextual variation points
-
Input: A design goal model
-
Activities:
1: Identify and specify the contextual variation points
2: Refine contexts
-
Outputs:
Contextual design goal model
Contexts refinements
In this second sub-process, the DGM constructed in the previous sub-process is refined with contextual variation points and their associated contexts are refined as demonstrated in Fig. 5.

Activities of Specification of contextual variation points activity
The contextual variation points represent the context influence on the choice among the available variants of goals satisfaction. They are annotated in the DGM to visually specify the effects of context in the system’s behavior. In the GO2S process, contexts can be associated to or /and refinements as well as contributions to softgoals present in a design goal model.
Accordingly, the architect should identify a contextual variation point and specify the variants at the DGM with context labels such as C1…Cn as shown in Fig. 6. We followed the notation proposed by (Ali et al. 2010) which requires that each context specified in the contextual DGM must be refined through a set of statements and facts. The contextual refinements are required in order to allow the system be able to check the validity of context at runtime. Hence, if a context is true, the variant is enabled.
As an example of context refinement, consider the refinement of C4 context related to Collect timetables by email task in Fig. 1. C4 will be true if The number of participants is high fact, or The meeting is not urgent statement (which can be checked by The meeting date is more than 2 days away fact), or The participants usually answer meeting requests by email statement (verified by The participants answered more than 50 % of timetables requests fact) are true. The contextual DGM of the meeting scheduler example is shown in Fig. 6.
The outputs of this sub-process are the contextual DGM and the context refinements. Next, we need to consider how the monitoring and adaptation will be performed.

Contextual DGM of meeting scheduler example
3.3 Sub-process 3: Specification of adaptation and monitoring
-
Goal: Refine the contextual DGM with elements necessary for the specification of adaptation Design Tasks as well as the monitoring
-
Input: Contextual design goal model
-
Activities:
1: Define the critical requirements that requires adaptation
2: Represent the adaptation management
2.1: Add a new design task in the root node for adaptation management
2.2: Add design tasks in the parent node previously created for the management of each requirement that must be monitored and adapted
2.3: Add design tasks to represent the adaptation strategies for each monitored requirement
3: Associate each adaptation design task with a context label
4: Refine each context
5: Identify the dynamic contextual elements
6: Represent the context monitoring
6.1: Add a new design task in the root node
6.2: Add design tasks to monitor each dynamic contextual element
7: Specify the context sources necessary to monitor the contexts
-
Outputs:
Contextual design goal model refined
Contexts Refinements
Context-sensitive systems have the ability of adapt themselves in order to provide personalized services for its users when enable /disable functions. Therefore, we propose to use this characteristic to deal with the requirements adaptation when a goal fails. In order to achieve this, we refine a contextual DGM with elements necessary for the specification of adaptation design tasks as well as the monitoring.
The input of this third sub-process (see Fig. 7) is the contextual DGM. The software engineer should analyze the system’s requirements, aiming to define the requirements that are critical, and therefore require some action in case of failure. Our approach does not prescribe any specific technique for elicitation and analysis of the requirements. Thus, the software engineer should choose existing requirement elicitation techniques that best fit. However, we can suggest some common sources of requirements that usually require adaptation since they are, usually, critical and impact the system’s behavior:
-
Softgoals present in the goal model;
Fig. 7 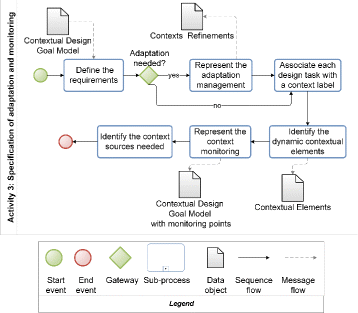
Activities of Specification of adaptation and monitoring activity
-
Goals that are critical for the system-to-be to fulfill its purpose, since some subsequent activities may depend on them;
-
Government regulations and rules may require that certain goals cannot fail or be achieved at appropriate rates;
-
Requirements related to Service Level Agreements (SLAs).

Next, adaptation design tasks should be added in the root node of the contextual DGM following the activity 2 described in the beginning of the section. These adaptation design tasks represent the tasks required for adaptation of each requirement the software engineer wants to adapt. We propose to add a new design task in the root node for adaptation management as well as design tasks in this node for each critical requirement that must be monitored and adapted.
Finally, design tasks should be added to represent the adaptation strategies. The adaptation design tasks can be of several types, such as reconfiguration of system’s parameters, step back or delegate the task to an user. Note that we should add at least two adaptation design tasks since the variants are the cornerstone for adaptability, a system with only one variant cannot be adaptable (Ali et al. 2010).
The next activity is to associate each adaptation design task with a context label meaning that these elements will be activated when the associated context holds. For example, consider the Manage Schedule adaptation design task in Fig. 9. This task will be executed when C6 context holds. According to the framework of (Ali et al. 2010), the contexts should be refined in statements and facts. The refinement of C6 context is presented in Fig. 8.

Refinement of C6 context of meeting scheduler example

Contextual DGM of meeting scheduler example refined with adaptation elements
Therefore, C6 context will hold when The Number of conflicts is higher than [MCA] (being MCA the Maximum Conflicts Allowed by the stakeholders) or when Schedule defined goal failed, i.e. the fact Goal is in the failed state.
After all contexts, that influence the requirements are refined, and the contextual elements that need to be monitored are identified, the next activity is to identify the context sources needed to monitor these contextual elements. The contextual elements are the properties of real-world presented in the facts of context refinements that change their values dynamically. Therefore, the changes in the contextual elements imply in changes in the system context.
The context sources can be represented in a table like Table 2 in order to facilitate the visualization and management by the software engineer.
In our running example, the software engineer decided that the system has to adapt itself when the Performance softgoal and the Schedule Defined goals fail. Therefore, two adaptation design tasks were added to our running example: Manage Performance adaptation and Manage Schedule adaptation.
The adaptation design tasks are Step Back and Reconfigure Schedule for the Manage Schedule adaptation design task; otherwise, Delegate (Software Architect) and Add new server are the adaptation tasks for the adaptation Manage Performance adaptation design task.
These adaptation elements of the meeting scheduler example are represented in Fig. 9. In this figure, C1-C5 are the contexts previously identified, while C6-C11 are the ones related to the requirements adaptation identified in this sub-process. These contexts must hold so the adaptation design tasks can be executed.
In our meeting scheduler running example, the only context source is a mechanism to information storage. The description of contexts and the context sources are presented in Table 2.
However, the world is volatile and could be in different states. A partial state of the world that is uniform does not influence the decisions of a system (Ali et al. 2010). Hence, the system should monitor the properties over the world that are dynamic and have a impact on system’s behavior namely contextual elements (see Section 2.1).
The facts and statements of a context will be activated when some change in the contextual elements occurs. Therefore, we should create a new design task, called Monitor Context for example, to represent the monitoring of the context. Then, for each one of the dynamic CE, a new design task should be created, expressing the need to monitor it. These tasks can have the form of Monitor [contextual element].
In the meeting scheduler system, we identified five CEs: meeting date, timetables responses, participants available dates, number of conflicts and response time. Thus, we added five design tasks to represent the monitoring of these contextual elements as shown in Fig. 9.
The outputs of this sub-process are the refined contextual DGM and context refinements. Having defined the adaptation strategies and the contextual elements that need to be monitored, we can now move on to specify the order of execution of tasks and goals. For this, we rely on flow expressions.
3.4 Sub-process 4: Specification of flow expressions
-
Goal: Refine the contextual design goal model with flow expressions that represent the execution order of elements in the model
-
Input: Contextual design goal model refined
-
Activities:
1: Assign an identification (ID) for each goal and task in the goal model
2: Determine the flow expressions
3: Specify idle states
-
Output: Behavioral contextual design goal model
In this sub-process, the contextual design goal model is refined with flow expressions that represent the execution order of elements in the model through the activities shown in Fig. 10.

Activities of Specification of flow expressions activity
Flow expressions are a set of enrichments to a goal model that allow specification of the runtime behavior through the execution order of its elements (see Section 2.3). These expressions are used in the GO2S process as an intermediary model in order to derive the statechart.
The first activity of the specification of flow expressions sub-process is to assign an identification to each goal and task in the model. This identification is necessary for reference in the flow expression later. Gi was used as the identification for goals and Ti for tasks and design tasks where i is the number of the task. Considering that there are different ways for a system to perform a set of tasks, determining the behavioral refinement (through flow expressions) is not a matter of direct translation (Pimentel et al. 2014).
After the IDs assignment, the next activity is to define the flow expression for each parent node which describes the behavior of its children elements using the symbols proposed by (Pimentel et al. 2014). The strategy can be bottom-up or top-down, the result will be the same. Thereafter, when we reach the root goal, we have the flow expression from the entire system. The resulting flow expressions should be annotated in the contextual design goal model as demonstrated in Fig. 11.

Behavioral contextual design goal model of the meeting scheduler example
The flow expressions could be defined taking in consideration the business rules of the system that were defined during the requirements phase. Therefore, the software engineer should analyze the requirements to determine the execution order of the tasks in the system, their optionality and multiplicity.
A common practice when creating statecharts is to use intermediate states as a point where the system is idle, waiting for some input, such as input selection by the user or for a context to hold. Considering how frequently these states appear, and aiming to reduce visual pollution in the behavioral contextual DGM, such states must be inserted directly in the flow expressions identified as iX, where X is an integer.
The result flow expression, presented in Fig. 11, of our running example is (i1 t16 i2 (g2 |g3 |g4 |t15)*) - t24 - t25.
Thus, from the idle state (i1), the system executes Manage Access (t16) design task, entering in an idle state (i2). The Meeting Characterized (g2), Timetables collected (g3), Schedule defined (g4) goals, and the Update meeting (t15) task are alternatives that can be executed zero or more times. Besides, Monitor Context (t24) and Manage Adaptation (t25) design tasks are running concurrently with all tasks.
The output of this sub-process is the behavioral contextual design goal model. It is the contextual design goal model annotated with flow expressions. This model can represent in a unified way all the views developed in the GO2S (contextual, design and behavioral).
The behavior of a context-sensitive system can be simulated, using tools such as (Yakindu Statechart Tools 2016) to help reason about the architecture’s ability to support the range of functionality and related quality requirements of the system (Clements et al. 2002). Hence, after defining the flow expressions, the next sub-process is the statechart derivation, which later can be used for analysis.
3.5 Sub-process 5: Statechart derivation and refinement
-
Goal: Obtain the statechart and perform the refinements
-
Input: Behavioral contextual design goal model
-
Activities:
1: Generate the statechart using the derivation patterns:
1.1: Create a state for each goal and task following the hierarchy of the design goal model
1.2: If necessary, create idle states to model situations where the system is waiting for user interaction or for a given context to hold.
2: Specify transitions in the statechart
3: Specify monitoring actions
4: Represent variants priorities
-
Output: Statechart
The statechart derivation and refinement sub-process relies on the behavioral contextual DGM as in input, as indicated in Fig. 12. The goal of this sub-process is to obtain the statechart and perform the refinements.

Activities of Statechart derivation and refinement activity
The flow expressions previously defined are translated into states of the statechart that represents the system’s behavior view. We adopted the set of derivation patterns proposed by (Pimentel et al. 2014). They are related to the different flows that may be expressed (sequential, alternative and concurrent) as well as to their optionality and multiplicity (see Fig. 13).

Statechart derivation patterns (Pimentel et al. 2014)
The generation of statechart consists of creating a state for each goal and task starting with the root node. The hierarchy of goals should be considered, therefore, each goal and task in and/or refinements becomes a superstate with its children nodes. We have six types of flows: sequential tasks, alternative tasks, concurrent tasks, optional execution, zero or more executions, one or more executions.
Sequential tasks are represented in the flow expression through the IDs separated by blank space (). Figure 14 shows an illustration of the statechart derivation of this type of flow from the behavioral design goal model.

Sequential tasks pattern
Alternative tasks are represented in the flow expression through the IDs separated by a vertical bar (|). An illustration of the statechart derivation of this type of flow is presented in Fig. 15.

Alternative tasks pattern
A hyphen (-) should be used to separate the IDs of concurrent tasks in the flow expression as shown in Fig. 16.

Concurrent tasks pattern
In a sequence flow, one of the tasks possibly will not be executed. Accordingly, a question mark (?) on the right of the ID in the flow expression should be used to represent this optionality as demonstrated in Fig. 17.

Optional tasks pattern
An optional task can be executed repeatedly. Hence, we should use an asterisk (*) on the right of the ID in the flow expression to represent that this task can be executed zero or more times. Figure 18 shows an illustration of the statechart derivation of zero or more executions tasks from the behavioral design goal model.

Zero or more executions pattern
Finally, we should use a plus sign (+) on the right of the ID in the flow expression to represent the repetition of tasks as presented in Fig. 19. The pseudocode of the derivation algorithm can be found at (Pimentel 2015).

One or more executions pattern
During the statechart derivation it can be necessary to specify more idle states to represent that the system is waiting for some input. These states should be represented though new states and the conditions required to hold should be specified in the transition of these idle states.
The procedure described above should be carried traversing the behavioral contextual DGM until it reaches the leaf nodes. After generating the statechart, we must specify its transitions in terms of their triggers and conditions. Any event can be used as a trigger, but there are five particular classes of events that are likely to appear in a statechart (Pimentel et al. 2014): user request, timer, requested by another task, requested by another system and context activation.
The monitoring of the environment in which the system is inserted is one of the main characteristics of context-sensitive systems. Accordingly, such activity impact the system’s behavior and it should be represented in the statechart. The results of the monitoring will define which facts and statements are true, causing changes in the system’s context. The management of such results should be implemented as functions of the system.
Therefore, we propose to refine the monitoring of the contextual elements adding triggers and actions. We use the every trigger which specifies periodic time events. Hence, in a periodic cycle, the actions responsible for the update of the contextual elements are executed. These update time should be specified according to requirements of each CSS by the software engineer.
Given that it is possible that several variants may be enabled in certain contexts, it is necessary to determine the best option. Hence, we propose to define a priority for such variants whose values are determined using the AHP method described in the next section. Such priorities are used in GO2S to configure the system’s behavior (allow/prevent transitions based on customization decisions).
We propose to represent the use of the variants priorities through operations. They receive as parameters the contexts associated with all variants in the refinement and their priorities. The operations should evaluate which variant must be executed considering the contexts that hold at the moment and the priorities of the variants. The returned values are used by guard conditions in the statechart to trigger the execution of the selected variant.
Figure 20 presents the complete statechart of our running example. The context activation is represented through the context labels (C1, C2…Cn) annotated in the behavioral contextual design goal model (Fig. 11).

Statechart of meeting scheduler example
The system starts in idle state (i1). If the user requests login in the system, Manage Access (t16) state is executed. In case of failure of the login, the system returns to the idle state (i1), otherwise, it enters in idle state (i2). From i2, the user can start to characterize the meeting, so, the system enters in Meeting Characterized (g2) superstate in which Define participants (t2), Define Date Range (t1) and Define topics (t3) states are reached, followed by the idle state (i2).
If the user requests to update the meeting, the system reaches the Update meeting (t15) state, later returning to idle state (i2). On the other hand, if collect timetables is requested, the system enters in Collect timetables (g3) superstate from Idle state (i4) where it should evaluate which variant should be executed considering the associated contexts (C3, C4, C5) and their priorities (p3, p4 and p5 whose values will be calculated in the next sub-process of GO2S). If only C3 holds, Input participants availability (t5) state is reached, otherwise if only C4 holds, Collect by email (t4) state is reached, and finally, if only C5 holds, Collect automatically (t6) state is reached. If more than one context hold, the decision of which variant should be executed is the one with higher priority (i.e. it is the variant that most contributes to the satisfaction of the system’s NFRs). After that, the system returns to idle state (i2).
If the user requests manually schedule, the system reaches the Schedule manually (t7) state. On the other hand, if C1 or C2 context holds, the system enters in Schedule automatically (t8) superstate. If only C1 holds, Brute Force Algorithm (t12) state is reached. Otherwise, if only C2 holds, Heuristics based algorithm (t11) state is reached. In case both contexts holds, the execution of the variant will be determined considering the associated contexts (C1, C2) and their priorities (p1 and p2).
Therefore, Characterize meeting (g2), Timetables collected (g3), Schedule defined (g4), Update meeting (t15) are alternatives states that can be executed zero or more times. All these states are running concurrently to Monitor Context (t24) and Manage Adaptation (t25) states.
Monitor Context (t24) is a superstate which has five states running concurrently: Monitor meeting date (t19), Monitor number of conflicts (t22), Monitor participants available dates (t20), Monitor response time (t23) and Monitor Timetables responses (t21). These sub-states represent the monitoring of dynamic contextual elements. The system updates, in a periodic cycle of 2 seconds update, the contextual elements. Hence, when some change occurs in any of these CEs, some context may hold and thus, the system should take some adaptation action.
Manage Adaptation (t25) is a superstate that represents the adaptation design tasks the system should perform in case of failure of critical requirements. It starts in a idle state (i7) and waits until C6 or C7 context holds. If C6 context holds, it enters in the Manage schedule adaptation (t27) superstate from idle (i5) state. When only C9 context holds, the Reconfigure Schedule (t14) state is reached, otherwise, if only C8 holds, Step Back (t13) state is entered. These states are executed as many times as necessary, until the contexts do not hold anymore. In case both contexts hold, the execution of the variant will be determined considering the associated contexts (C8, C9) and their priorities (p8 and p9).
When C7 context holds, the system enters the Manage performance adaptation (t26) superstate from the idle state (i3). When only C11 context holds, the Delegate (Software Architect) (t17) state is reached. Otherwise, if only C10 holds, Add new server (t18) state is entered. In case both contexts hold, the execution of the variant will be determined considering the associated contexts (C10, C11) and their priorities (p10 and p11). Similarly, these states are executed many times as necessary until the contexts do not hold anymore.
The statechart can be used to requirements validation, hence, the software engineer will be able to check if the system will behave as expected. This model can also be used in the next phase of the software development (implementation) to generate code through tools such as (Yakindu Statechart Tools 2016).
The calculation of the variants priorities is explained in the next section.
3.6 Sub-process 6: Prioritization of variants
-
Goal: When more than one context holds prioritize variants
-
Input: Behavioral contextual design goal model
-
Activities:
1: Define the preferences for variants over each NFR
2: Determine the weights of each NFR
3: Synthesize the results
4: Verify the consistence
-
Output: Vector of variants priorities
The system’s variants are applicable only if their associated contexts hold. However, in a certain execution, more than one variant may be enabled in the actual context. Therefore, the system has to implement runtime mechanisms to decide on the best choice of variant to adopt. In our work, we are concerned with the satisfaction of the NFRs since they have a impact on the system’s behavior. Hence, we consider the variant contribution for the NFRs satisfaction when choosing the best one when more than one hold at runtime.
In order to determine the variant contribution, we propose the use of the Analytical Hierarchical Process(AHP) method (Saaty 1987). We adopted this method because of its benefits are well described in the literature (Brito et al. 2007): it is a well-known and accepted method; it is appropriate for handling conflicting concerns problems; it has the ability to quantify subjective judgements; it is capable of comparing alternatives in relation to established criteria; and it provides means to guarantee the logical consistency of the judgements.
The AHP method is used in the GO2S process to produce a ranking of variants (alternatives) that most contributes for the satisfaction of NFRs (criteria). First, it is necessary to establish priorities for the main criteria by judging them in pairs for their relative importance, thus generating a pairwise comparison matrix. Judgements which are represented by numbers from the fundamental scale are used to make the comparisons. The number of judgements needed for a particular matrix of order n, the number of elements being compared, is n(n - 1)/2 because it is reciprocal and the diagonal elements are equal to unity (Saaty 1987).
It should be noted that AHP analysis can be performed using a spreadsheet tool, which shows that there is no need for a sophisticated tool support to implement this method. The activities required for NFRs prioritization are depicted in Fig. 21.

Activities of prioritization of variants activity
In our running example, we took in consideration three NFRs (usability, security, performance) and that it is possible that C3, C4, and C5 contexts of Fig. 11 hold at the same time. Figure 22 illustrates the hierarchical tree of this example.

AHP hierarchical tree of the meeting scheduler example
The first activity of this sub-process consists in defining the preferences for variants (alternative) over each NFR (criteria). In order to achieve this, we considered the contributions links Make, Help, Hurt and Break that can be presented in the behavioral contextual DGM. In case of changes in the contribution links that are context-dependent, the new values of the contributions should be considered. The system should update the contribution strength at runtime and perform new analysis of the variants.
The contributions can also be represented, respectively, by ++, +, - and - - (Santos 2013). The variants contribution for each NFR are represented through the contribution links as demonstrated in Table 3 for the meeting scheduler example. These contributions values presented in this table are fictional, subjective and based on our experience. In a real setting, the stakeholders should be consulted.
Santos (2013) defined a mapping, presented in Table 4, to convert from the variants contribution (demonstrated in Table 3) to AHP scale (Saaty 1987). Note that in the first row, ++ sign has a importance from 1 (when compared to ++) to 9 (when compared to - -). On the other hand, in the last row, the - - sign has an inverse importance varying from 1/9 (when compared to ++) to 1 (when compared to - -).
The pairwise comparisons between the variants for each NFR is done by creating a matrix for each NFR to compare all values of variants contributions. Hence, matrices n x n (with n as the number of variants) will associate the variants according to their contribution to the selected NFR. In our running example, we have three NFRs, hence we constructed three matrices. The results of these comparisons are presented in Tables 5, 7, and 9.
In order to determine the vector of variants priorities for the Performance NFR, we should calculate the normalized pairwise comparison matrix. Its elements are determined by dividing each element of the comparison matrix (Table 5) by the sum of each column. The normalized pairwise comparison matrix for the variants contributions to the Performance NFR of meeting scheduler example is presented in Table 6.
Then, we find the estimated relative priorities by calculating the average of each row of the normalized matrix. Finally, we have the priority vector for the pairwise matrix. The vector of variants priorities for the Performance NFR is [var3 = 0.28, var4 = 0.074, and var5 = 0.643].
The results of the comparisons of the variant’s contributions to the Security NFR of meeting scheduler example are presented in Table 7.
The normalized pairwise comparison matrix for variants contributions to the Security NFR is presented in Table 8. Accordingly, the vector of variants priorities for this softgoal is [var3 = 0.074, var4 = 0.283, and var5 = 0.643].
The results of the comparisons of the variant’s contributions to the Usability NFR of meeting scheduler example are presented in Table 9.
The normalized pairwise comparison matrix for variants contributions to the Usability NFR is presented in Table 10.
Accordingly, the vector of variants priorities for the Usability NFR is [var3 = 0.106, var4 = 0.26, and var5 = 0.633].
In order to determine the weights of each NFR, the software engineer should compare all pairs of NFRs and assign a value to each pair using the AHP scale. The results of the pairwise comparisons of the meeting scheduler example with three NFRs (usability, security, performance) are shown in Table 11. These assigned values are fictional, subjective and based on our experience.
The normalized pairwise comparison matrix for the NFRs of the meeting scheduler example is presented in Table 12.
The NFR priorities vector of the meeting scheduler example is [Performance = 0.643, Security = 0.283 and Usability = 0.074]. Hence, we can notice that Performance is the most critical NFR followed by Security and Usability.
After defining the preferences for variants over each NFR, as well as the weights of each NFR, the next activity is to synthesize these results. Accordingly, the vectors of variants priority for each NFR are combined into a single matrix. This new matrix is multiplied by the NFR priority vector obtained from the NFR importance matrix to obtain the overall objective (i.e., ranking of variants).
Table 13 shows the final ranking in our running example. We can notice that the var5 (collect automatically) is the one that contributes mostly for the satisfaction of the NFRs (0.67) followed by var3 (collect by phone) with 0.21 and var4 (collect by email) with 0.15.
The final activity of the prioritization is to check the consistency of the judgements that the software engineer demonstrated during the pairwise comparisons. The logical quality of the decisions is guaranteed by computing the consistency ratio (CR), which measures the consistency of the pairwise comparison judgements. The required procedure to calculate these ratios are described in (Saaty 1987). When the consistency ratio exceeds 0.10 appreciably the judgements often need reexamination. This reduces any possible error that might have been introduced during the judgement process (Saaty 1987).
We used a spreadsheet tool to determine the consistency ratios of the meeting scheduler example. For the pairwise comparison matrix for NFRs (Table 11), we obtained a consistency ratio of 0.056. Otherwise, the consistency ratios for the variants contribution for performance, security, and usability were 0.056, 0.056, and 0.033 respectively. These ratios are a good indication that logical consistent judgements were made on all pairwise comparisons, because they are below the required 0.1 threshold (Saaty 1987).
In the next section, we will describe the controlled experiment we conducted to evaluated the GO2S process empirically.
4 Controlled experiment
In order to evaluate our proposal we designed a controlled experiment. We conducted a multi-test within an object study since we examined a single object (the Smart Home System) across a set of subjects. This empirical method can be used when it is possible to control those using the approach method, and when and where they are used (Wohlin et al. 2012). Hence, it allows the control of, for example, subjects, objects and instrumentation. This ensures that we are able to draw more general conclusions.
Experimentation is a labor-intensive task and is not simple; therefore, we had to prepare, conduct and analyze the experiment properly. In order to make sure that the proper actions were taken to ensure a successful experiment, we followed the framework proposed by (Wohlin et al. 2012) for performing experiments in software engineering. The authors propose five activities in order to perform an experiment: Scoping, Planning, Operation, Analysis & interpretation, and Presentation & package. The results obtained in each activity are described in the following subsections.
4.1 Scoping
The scoping specifies the motivation for performing the experiment. Hence, we began setting its objectives. The goal of our experiment is summarized in Table 14. After the definition of the experiment scope, the next activity is the Planning (Wohlin et al. 2012).
4.2 Planning
Planning defines how the experiment should be conducted. It is divided into six steps: Context Selection, Variables selection, Hypothesis formulation, Selection of subjects, Experiment design, Instrumentation and Validity evaluation. These steps are described in details in next subsections.
4.2.1 Context selection
The context of our experiment is students of undergraduate, master’s and doctor’s degree from a Requirements Engineering course at a university. The subjects were eighteen students enrolled in the course. The experiment was run off-line (not in an industrial software development environment). The ability to generalize from this specific context is further elaborated in Section 4.6 where we discuss threats to the experiment.
4.2.2 Variables selection
In the design of experiments, we have to consider what independent variables or factors are likely to have an impact on the results. In our experiment, the independent variables were the use or not of GO2S process.
On the other hand, we considered five dependent variables, based on the metrics related to evaluate our process: time to implement, syntactic correctness, structural complexity, behavioral similarity, and cognitive complexity. These metrics were already used in the literature to evaluate behavioral models (Dijkman et al. 2011) (Miranda et al. 2005). They are described as following:
-
1.
Implementation time: the time that subjects spent to develop the statecharts measured in minutes. This metric was used to investigate if there was a significant difference in the time spent using the GO2S process.
-
2.
Syntactic correctness: we measured this variable through the number of syntactic errors and warnings indicated by the Yakindu modeling tool (Yakindu Statechart Tools 2016) (used by all subjects in this experiment) in the final statechart model that the subjects delivered to us. This metric was used to investigate how well the subjects of each group learned the statechart language as well as to verify if the groups were well balanced.
-
3.
Structural complexity: this variable is determined by the different elements that compose the model (Miranda et al. 2005), such as states, transitions, activities, etc. Hence, we evaluated the structural complexity of statecharts through different metrics: the number of super states, orthogonal states, idle states, final state, simple states, state transitions, choice, variables and actions. High structural complexity has an impact on the cognitive complexity of statecharts (Miranda et al. 2005). This metric was used to investigate the structural complexity of the statecharts obtained using (or not) the GO2S process.
-
4.
Behavioral similarity: each software engineer constructs a model according his experience and knowledge. Accordingly, the behavioral similarity intends to explore the behavior (i.e. the order of execution flows of the tasks) of different models despite their structural differences (Dijkman et al. 2011). We measured the behavioral similarity analyzing if the statechart, produced by the control and experimental groups, behaves as expected through the percentage of the number of functionalities modeled as described in the requirements model in relation of the total number of functionalities. This metric was used to check if the behavioral similarity of the statecharts produced of the experimental group was higher than those of control group.
-
5.
Cognitive complexity: this metric can be defined as the mental burden that the persons have to deal with the process. Hence, the cognitive complexity of each sub-process of the GO2S process was evaluated through the subject’s opinion about the sub-processes and notations used in the GO2S process. Thus, we applied an anonymous questionnaire with different assertions (see Table 15) about the GO2S process. The subjects had to choose an option using the following scale: Totally Disagree, Disagree, Indifferent, Agree, and Totally Agree. This metric was used to investigate if the GO2S process were specified in a understandable way.
Table 15 Statements used to evaluate cognitive complexity
4.2.3 Hypotheses formulation
The main hypotheses are the null hypotheses that states there is no difference between using or not the GO2S process. Therefore, the study tries to reject them. There are fourteen null hypotheses, one for each metric the study analyzes. Table 24 describes the null and alternative hypotheses of this experiment.
4.2.4 Selection of subjects
According to (Wohlin et al. 2012), the selection of subjects is also called a sample from a population. In our experiment, we performed convenience sampling: the nearest and most convenient persons are selected as subjects.
In order to identify the impacts of the use of the GO2S process, the subjects were divided in two groups with nine subjects each: the subjects of one group generating statecharts using the proposed process (experimental group), whereas the other subjects did not use the proposed process (i.e. they belonged to the control group). This distribution of the subjects in the two groups was performed randomly.
4.2.5 Experiment design
In our experiment, we compared two treatments: the use or not of the GO2S process. Therefore, the design of our experiment was classified as one factor with two treatments being of the type completely randomized design. The design setup uses the same objects for both treatments and assigns the subjects randomly to each treatment. Each subject uses only one treatment on one object (Wohlin et al. 2012). Since we had the same number of subjects per treatment, the design was balanced.
4.2.6 Instrumentation
The instruments for an experiment are of three types, namely objects, guidelines and measurement instruments (Wohlin et al. 2012). Therefore, for each subject, we prepared a set of materials to be used in the experiment as described in the following subsections.
4.2.7 Experimental object
The subjects received a specification of a Smart Home System designed to make life easier for people with dementia problems and provide continuous care about them to ensure their safety and comfort. To this end, the Smart Home had to act in response to the context. In this experiment, we used a simplified version of the system adapted from description available at (Ali 2010).
4.2.8 Guidelines
The subjects were aware that their data would be used by the experimental study. The experimental group that applied the GO2S process also received a reference guide with a summary of the activities and the notations used by our process. In addition to the reference guide, the subjects of the experimental group also attended 4 h of course to learn our process.
4.2.9 Measurement instruments
All subjects answered a pre-experiment questionnaire to inform their profile and experience in system modeling. Moreover, the subjects also filled a questionnaire post-experiment to express their opinions about each sub-process. We collected their statecharts and all the material used in the experiment for evaluation.
4.3 Operation
In the operational phase of the experiment, the treatments were applied to the subjects. This phase consists of three steps: preparation, execution and data validation.
4.3.1 Preparation
As previously mentioned, this study was performed using subjects enrolled in undergraduate and graduate course and consisted of two trainings to the subjects. In the first one, we provided classes about the goal model (Castro et al. 2002), the statecharts theory (Harel 1987) and the yakindu tool (Yakindu Statechart Tools 2016) to the participants of both groups (control and experimental group).
We took extra care to check if the subjects had indeed learned adequately the statecharts theory since it was a pre-requisite to participate in the experiment. They were asked to work on a course project in which they had to model a statechart from a given requirements specification (provided by the instructors). Besides the project modeling, we also performed an oral argumentation with each subject, to check the quality of their project handout and aquaintacy/familiarity with the statechart theory (Harel 1987) and modeling tool (Yakindu Statechart Tools 2016).
The second training consisted in presenting/teaching the students the GO2S process to the subjects of the experimental group (9 subjects) and performing a dry run to give the subjects a chance to familiarize with activities of the process. The control group also had an opportunity to exercise the statecharts language in a domain different from the one of the experiment.
Finally, the experiment was executed. The time spent in each activity was the following:
-
Classes about goal model, statecharts theory and tool to all subjects: 8 h
-
Oral argumentation with all subjects: 3 h
-
Training about the process to the subjects of the experimental group: 4 h
-
Dry run with all subjects: 4 h
-
Experiment: 3 h
The time spent to execute the experiment was 22 h. Besides this execution time, there was the time spent in meetings for decision-making, the preparation of the project, answering questions of students and correcting all projects. In addition, there was the time spent on preparing slides, the material used in the experiment and the time required to analyze the results. Hence, the total time was approximately 132 h.
4.3.2 Execution
The experiment was carried out in a computer laboratory with the two groups. Each subject of the control group developed a statechart for the Smart Home System from the requirements specification. On the other hand, each subject of the experimental group developed a statechart following the GO2S process. We asked the subjects of the experimental group to perform the sub-processes 1 to 5 of the GO2S process, since the last one concerns with the variants prioritization that was not possible to compare to the control group. All subjects had to perform the following experimental tasks:
-
To write down the start and end time of the experiment.
-
To fill out a pre-experiment questionnaire, which included academic and industry experience.
-
To construct the statechart using the Yakindu tool (Yakindu Statechart Tools 2016).
-
The experimental group also had to fill out a post-experiment questionnaire.
4.3.3 Data validation
The subjects’ data were validated. When subjects finished the experiment, we checked for each one of them, if their data forms were filled in a reasonable way. Furthermore, we also checked that everybody has understood how to fill in the data in a correct way.
4.4 Analysis and interpretation
The data collected during operation step provided input to the Analysis & interpretation activity. During the analysis phase, we understand the data while the interpretation phase determines whether the hypotheses was accepted or rejected (Wohlin et al. 2012).
In the operation phase, we applied a pre-experiment questionnaire to each subjects of both groups in order to investigate their profile and previous experience. From the analysis of Fig. 23, we can notice that both groups were well balanced. They were students of different course types (undergraduate, and graduate - including master’s and doctoral students) and they had different background, i.e. they attended/or were attending different undergraduate courses. The majority studied/is studying computer science.

Subject’s profile
We also asked the participants about their experience with behavior modeling and the results are shown in Fig. 24. The subjects had some experience with behavior modeling and both groups were more experienced with use case diagram and class diagram. These notations have a different level of abstraction compared to statecharts.

Experience in behavior modeling
We requested the subjects to answer about their level of proficiency on behavioral modeling (statecharts and other modeling languages). The results are presented in Fig. 25. The majority (of both groups) said that they had proficiency in modeling languages. It is important to note that this is a subjective affirmation that depends on how the subjects evaluate their knowledge.

Proficiency in behavior modeling languages
After conducting the experiment, we analyzed each statechart produced by each subject of both groups in order to measure the dependent variables.
In relation to the syntactic correctness, the number of syntactic errors and the number of warnings of each subject of the control group is presented in Table 16. The results of the experimental group are presented in Table 17. From the results presented in these tables, we can conclude that the number of syntactic errors was 66.67 % higher than the number of control group. Analysing these results, we noticed that the syntactic errors were made by two subjects (4 and 8 mistakes) in the control group and by one subject in the experimental group (4 mistakes).
This high number of syntactical errors in the control group was caused by two participants. The other subjects did not make any syntactic error. The subject that made 4 syntactic errors in the control group did not consider himself/herself proficient in some system modeling language although he/she have already used a language for system modeling before the experiment. The subject that made 8 syntactic errors in the control group agreed that he/she has proficiency in system modeling languages. The syntactical errors in the experimental group were made by one subject. This subject did not agree that he/she is proficient in state diagrams or other system modeling languages.
The number of warnings, on the other hand, was 64.29 % higher in the experimental group. In relation to the control group, these errors were made by two subjects (2 and 3 errors). The subject that made 2 errors agreed that he/she has proficiency in state diagrams including statecharts and said that he/she is indifferent to others system modeling languages. The subject that made 3 errors did not considered himself/herself proficient in any system modeling languages.
In relation to the number of warnings of the experimental group, these errors were made by two subjects (7 errors each). One subject agreed that he/she is proficient in state diagrams and statecharts and he/she is indifferent to other system modeling languages. The other subject also agreed in his/her proficiency in state diagrams and totally agreed that he/she is proficient in other system modeling languages.
Accordingly, we can infer that the level of proficiency in statecharts and other system modeling languages said by the subjects does not have a direct impact on the results of syntactic correctness.
Tables 18 and 19 present the results of the metrics used to characterize the structural complexity of statecharts (superstates, orthogonal states, idle states, final states, simple states, state transitions, choice, variables and actions) of each subject in the experiment. From the analysis of these tables, we can notice that the experimental group used more superstates, orthogonal states, idle states. The control group, on the other hand, used more final states, simple states, state transitions, choice, variables and actions. When we grouped these values (see Tables 19 and 18), we found that the structural complexity of control group was 8.33 % higher (mean of 68 elements) than the experimental group (62.33 elements). These results indicate that for the scenario in which the experiment was conducted that the structural complexity of the statecharts generated using the GO2S process was lower than the satecharts produced not using it.
The behavioral similarity was another dependent variable analyzed in the statecharts. Tables 20 and 21 show the results of each subject of control and experimental groups. These values were calculated by analyzing each statechart of all subjects and verifying if the functionalities behave (in sequence, parallel, alternative and other possible flows) as described in the requirements specification. Finally, we calculated the percentage of correct functionalities from the total number of functionalities.
Considering the behavioral similarity, we observed that the number of correct functionalities i.e. they behave as described in requirements specification is higher in the experimental group. Therefore, the mean of behavioral similarity of the experimental group was 21.49 % higher than the control group as indicated in Tables 21 and 20.
Moreover, the time spent by each subject to construct the statechart is presented in Tables 20 and 21. From the results of these tables, we can conclude that the time to construct the statecharts was slightly higher (119.67 min) than the control group (108.56 min) with a small difference of 11.11 min (9.29 %). These results indicate that, although there is an extra effort to perform all the sub-processes of the GO2S process, the extra time required is not significant compared to not using it.
We also asked the subjects of the experimental group to fill out a post-questionnaire form in order to obtain their cognitive complexity about the process. We provided fifteen statements (presented in Table 15) where they had to choose an answer using the following scale: Totally Disagree (TD), Disagree (D) Indifferent (I), Agree (A), Totally Disagree (TA). For the questions not answered by the subjects, we marked as Not Answered (NA). The results of the cognitive complexity of GO2S process are listed in Table 22. These results indicate that the GO2S process is easy to understand.
4.4.1 Statistical hypotheses testing
The heterogeneous characteristics of the dependent variables of this experiment motivated the realization of normality tests in the data.
Before the application of the normality tests, we analysed the distribution of the variables by constructing the boxplots. Figures 26, 27, 28, 29 and 30 present the boxplot of the variables implementation time, syntactic errors, warnings, behavioral similarity and structural complexity (considering the sum of all elements of the statechart) respectively.

Boxplot of the variable implementation time

Boxplot of the variable syntactic errors

Boxplot of the variable warnings

Boxplot of the variable behavioral similarity

Boxplot of the variable structural complexity
In this work, we used the Kolmogorov-Smirnov normality test whose results are listed in Table 23. The normality tests of the variables Syntactic Errors, Warnings, Final States, Choice of the control group as well as the variables Syntactic Errors and Warnings of the experimental group rejected the hypothesis that the data are normally distributed since their p-value is smaller that the significance level adopted in this work (5 %), i.e. the the confidence level is (95 %). The Kolmogorov-Smirnov applied to the other variables, listed in Table 23, did not reject the normality of the data.
We applied parametric and non-parametric tests in order to perform the hypotheses testing of this experiment. Table 24 describes the hypotheses evaluated in this paper. The results are presented in Table 25.
The results of this experiment allowed the rejection of the hypotheses that the number of transitions modeled by the control group is equal by the ones modeled by the experimental group (pair H04 and H17). Accordingly, we can accept the hypothesis that the control group used more transitions that the experimental group. This contributes to the higher structural complexity of the control group.
The hypothesis that the number of super states of the control group is equal that the number of super states of the experimental group was also rejected (pair H06 and H112). Hence, we can accept that the number of super states of the control group is smaller that the number of super states of the experimental group. Although this means a smaller structural complexity of the control group, this can also indicate a higher modularization of the models produced by the experimental group.
Another rejected hypothesis was the pair H07 and H114. According to this hypothesis, the number of orthogonal states of the control group is equal that the number of orthogonal states of the experimental group. Therefore, we can accept that number of orthogonal states of the control group is smaller that the number of orthogonal states of the experimental group. A consequence of this result is that the subjects of the control group did not represent the monitoring required in context-sensitive systems. Besides, this also explains why the subjects of the control group did not represent the functionalities that should behave in parallel correctly.
The rejection of the pair H08 and H116 allows accepting that the number of idle states of the control group is also smaller than the control group. This result is also related with the monitoring required in context-sensitive systems. The idle states are necessary to the system adapts itself if some requirement is not bring satisfied or it needs providing an specialized service to its users. Hence, many subjects subjects of the control group did not consider such monitoring and adaptation.
Another rejected hypothesis was that the number of action in the models developed by the control group is equal to the number of actions in the model produced by the experimental group (pair H012 and H123). Therefore, the subjects of the control group used more action than the experimental group.
The pair H013 and H126 was also rejected. Therefore, we can accept that the behavioral similarity of the experimental group is higher the control group. Accordingly, we can say with a confidence level of 95 % that the number of requirements that behave as described in the specification of the experimental group is higher than the number of control group. This is the most important contribution of the GO2S process since the proposed sub-processes for the derivation of the statechart from the goal model allow the software engineer to focus on the flows on the system’s variants instead of its structure.
The results of statements in the post-experiment questionnaire, presented in Table 22, showed that hypothesis H014 is rejected. Hence, the subjects of the experimental group agreed that the GO2S process is easy to understand.
4.5 Presentation and package
The subjects of our experiment were students of different course types (graduate and undergraduate students) having the mostly studied/is studying computer science course. They stated that they have modeled the behavior of systems previously and both groups have more experience with use case diagram and class diagram. Besides, the majority of both groups agree that they had proficiency in modeling languages.
After analysing the statectharts produced by the subjects, we can conclude in relation to the syntactic correctness, the number of syntactic errors of control group was 66.67 % higher than the number of the experimental group. The number of warnings, on the other hand, was 64.29 % higher in experimental group.
Moreover, the structural complexity of control group is higher (mean of 68 elements) than experimental group (62.33 elements) corresponding to a reduction of 8.33 %. In addition, the mean of behavioral similarity of experimental group was higher (75.56 %) than control group (54.07 %) corresponding to a difference of 21.49 %. Besides, the time spent by the experimental group to construct the statecharts was higher (119.67 min) than the control group (108.56 min) with a difference of 11.11 min (9.29 %).
The nine subjects that applied our process also filled out a post-questionnaire in which they expressed their opinion about the process using the following scale Totally Disagree, Disagree, Indifferent, Agree and Totally Agree. We asked their opinion about easiness to apply the process and all subjects agreed (66.67 % agreed and 33.33 % totally agreed) that the process is understandable. The results of our experiment are discussed in Section 5.
4.6 Threats to validity
This section discusses how valid the results are and if we can generalize them to a broad population. According to (Wohlin et al. 2012), there are four kinds of validity: internal, conclusion, construct and external.
4.6.1 Internal validity
Internal validity analyzes if the collected data in the study are result of the dependent variables and not from an uncontrolled factor. We tried to mitigate the selection bias (i.e. there are differences between the subjects’ expertise) by performing a random assignment of the subjects to the control group and the experimental group.
Despite being separated in two groups, one that used the GO2S process and the other that did not use, both groups received the same goal model and system specification. Therefore, we did not expect the subjects to be unhappy or discouraged in performing or not the treatment, since the resulting statechart should be behaviorally equivalent. Moreover, given that the experiment was performed in one day related to a domain that they had no contact before, we mitigate the history and maturation effects by making observation at a single time point.
One may claim that training the subjects of the experimental group about the GO2S process increases that group familiarity with the models. However, the control group had only 4 h less training than the experimental group. This can introduce a threat to validity about the training hours but it is minimized since the statecharts of both groups can be behavioral equivalent. Hence, it is possible to construct the statechart without any guidance. Therefore, we believe that this factor did not cause so much harm in the results. Moreover, the training of one group instead of another is a common issue when performing experimental studies that have control group to validate some technique. Besides, it should be noted that this is a common practice in the experimental community when performing controlled experiments.
4.6.2 Conclusion validity
Conclusion validity is related to the ability to reach a correct conclusion about the collected data, as well as the reliability of measures and the collected data. We tried to improve the reliability of treatment implementation by using the same treatment and providing the same training, with the same instructor for all subjects of the experimental group. If the training was provided by different instructors, it would not possible to infer whether the results were influenced by the training or they were derived from the GO2S process. Thus, we mitigate this possible threat to the validity. We also attempted to improve the conclusion validity by randomly choosing the subjects of both groups, thus promoting heterogeneous groups that were not correlated with the dependent variables.
Moreover, formal designs and the resulting statistical robustness are desirable, but we should not be driven exclusively by the achievement of statistical significance. Common sense must be maintained, which allows us, for example, to experiment just to help develop and refine hypotheses (Basili et al. 1986). Besides, the number of subjects in our experiment is too small to reject all hypotheses we proposed to evaluate.
4.6.3 Construct validity
Construct validity is concerned to the relationship between the concepts and theories behind the experiment as well as what is measured and affected. The implementation time is not a good measure to compare models since construct a model fast does not mean that it is correct and it does what it is supposed to do. Hence, we believe the most important metric evaluated in this experiment is the behavioral similarity since this metrics analyzes if the model behaves as expected through the percentage of the number of functionalities modeled as described in the requirements model in relation of the total number of functionalities.
We developed an expected response of the derivation process, but it was not an authoritative correct answer since the model can have structural differences and still behave in a similar way. We compare the models developed by the subjects and we found differences, we simulated it in the yakindu tool to analyzed if it behaves as we specified in the requirements specification provided to the subjects in the experiment. In other words, the execution order of the tasks related to some functionality was modeled as described in the system specification. For example, if some functionality requires that a set of tasks should be executed in parallel or in sequence or as alternatives, the subjects should have modeled it as the expected flow execution.
4.6.4 External validity
External validity is concerned with the ability to generalize the results to an industrial environment. One expected result of this study is to guide software engineers on when to use (or not) the GO2S process. As we used randomization to separate the subjects in two groups, we expect a decrease on the confounding factors (factors that can influence the results of the experiments), since the most important is the subjects’ expertise.
The context of our experiment is students of undergraduate, master’ and doctor’s degree from a Requirements Engineering course at a university. Even though we had different types of students, the limited number of subjects does not allow to generalize outside the scope of the study. On the other hand, we expect that the results, including the subjects’ feedback, can be used as guidelines to improve our process.
Someone could argue that we should use professionals in experiments because there may be many differences between students and professionals. However, (Svahnberg et al. 2008) demonstrated that there is not necessarily much difference between students and professionals in many experimental settings.
According to (Svahnberg et al. 2008), students can be expected to be, at least, reasonably representative if compared to industry people introduced to a novel technique for the first time, which would have been the case if we had access to professional context-sensitive developers as subjects. Furthermore, (Runeson 2003) demonstrated that in spite of differences between freshmen, graduate students, and practitioners (though less between the two latter groups), they all showed tendencies in the same direction.
The lack of professionals in software engineering experiments is due to the conception of high costs and large organizational effort. Many authors, such as (Basili et al. 1986), (Fenton 1993) and (Sjoberg et al. 2002) point out the difficulties of conducting controlled software engineering experiments in realistic environments. Accordingly, these environments can also be a weakness, because there are an enormous number of factors that differ across environments, in terms of desired cost/quality goals, methodology, experience, problem domain, constraints, etc (Basili et al. 1986).
Therefore, it may be too costly or impossible to manipulate an independent variable or to randomize treatments in real life (Sjoberg et al. 2002). Even if we can somehow gather a sufficiently large group of professionals, the logistics of organizing the group into a set of experimental subjects can be daunting due to schedule and location issues. Moreover, according to (Sjoberg et al. 2002), empirical software engineering research departments should have particular budgets for paying students and software professionals for taking part in experiments. Unfortunately, this was not our case.
A non-controversial use of student experiments is to use them to test experimental design and initial hypotheses, before conducting experiments with professionals, as recommended by (Sjoberg et al. 2002). According to (Carver et al. 2010), it can make sense to use students for initial experiments, to see whether the experiment design works. We agree with these arguments and we tried to mitigate confounding factors by performing a careful experiment in which we tried to use an appropriate assessment criterion.
Although the results are limited by the narrow scope, we believe that the process and the study design are considerable contributions. This experiment can guide other studies in order to evaluate the proposed process with more general and conclusive results and can also support other kind of studies.
4.7 Ethics
In our controlled experiment, we were committed to make our research ethical. Therefore, we addressed the ethical principles that form the core of several research ethics guidelines and codes: informed consent, beneficence, confidentiality (Vinson and Singer 2008).
The principle of informed consent stipulates that potential subjects should be informed of all relevant facts about a study before making an explicit, free and well-considered decision about whether to participate (Vinson and Singer 2008). Therefore, we provided to subjects all the information necessary to understand how the research would affect them: the purpose of the research, its procedure, the risks to the subjects, the anticipated benefits to the subjects, alternatives to participation, the treatment of confidential information, the voluntary nature of participation, and a statement offering to answer the subjects’ questions.
The degree of beneficence results from a weighted combination of risks, harms, and benefits to the subjects and society from participation in a study (Vinson and Singer 2008). In our experiment, the risks of harm were minimized by protecting the confidentiality. The principle of confidentiality refers to the subjects’ right to expect that any information they share with researchers will remain confidential (Vinson and Singer 2008).
Accordingly, we executed procedures in order to maintain confidentiality and reduce the risks of harm. During the experiment, we randomly assigned a number to each participant and they answered all questionnaires anonymously. Therefore, the data anonymity was preserved since the analysis of the data could not reveal the identity of the subjects.
In the next section, we discuss the results obtained in this paper.
5 Discussion
Software-development organizations frequently begin their activities with one of these alternative starting points - requirements or architectures - often adopting a waterfall development process. The start from the requirements produces artificially frozen requirements documents for use in the next step in the development life cycle. Starting from architecture, on the other hand, creates systems with constrained architectures that restrict users and handicap developers by resisting inevitable and desirable changes in requirements (Nuseibeh 2001).
Software engineers have difficulties to understand and define what to consider as context and how to design context-sensitive systems. This is due to the lack of consensus in the literature regarding the terminology, characteristics and specificities necessary to develop them. Hence, there is a need for approaches to guide the designers to perform activities related to the specification of the behavior of context-sensitive systems.
This paper proposed the GO2S systematic process for obtaining the behavior of context-sensitive systems (expressed as statecharts) from requirements models (expressed as goal models) following the twin peaks concept (Nuseibeh 2001). It is an iterative process centered on the incremental refinement of a goal model, which provides different views of the system (design, contextual, behavioral). Accordingly, it may be necessary to go back and forth in the sub-processes until the desired level of detail is reached.
A general engineering principle for managing complexity is to (a) decompose a system into multiple smaller components that can be worked with individually through multiple phases of development, and (b) integrate components in later stages of development to form a complete system. Decomposing systems into components can also lead to cost reductions and decreased development time when components are reused across multiple systems (Hatcliff et al. 2014).
We explored the idea that it is possible to modularize the development of CSS by organizing the GO2S process in six sub-processes considering the main activities in order to develop a context-sensitive system: requirements specification, context specification, the adaptation and monitoring, the definition of system’s behavior, the statechart derivation and the prioritization of variants. We hope that this modularization can aid the maintenance and evolution of CSS, diminishing the complexity on building these applications.
Furthermore, we proposed to specify the adaptation and monitoring tasks connected directly in the root goal since we want to separate these concerns. Accordingly, at the same time the system provides the functionalities to the user, it also has to monitor de context in order to detect changes in the contextual elements as well as adapt itself in case of failure of requirements previously or because it is necessary to provide a specialized service to the user. Accordingly, the statechart of the context-sensitive systems should have at least three parallel states (requirements, monitoring and adaptation).
Flow expressions were used to specify the system behavior and thus, help the derivation of statecharts. These expressions are useful because they can aid in the design, analysis, and understanding of software systems (Shaw 1978). Since every goal and task should be present in the flow expression, excepting the ones assigned to users, we can check the completeness of the derivation. Hence, every element should correspond to a state in the statechart.
In comparison with the work of (Pimentel et al. 2014), the main difference is that we address the system’s context, the operationalization of the NFRs and prioritization of variants. This prioritization was performed using the AHP method. This method uses a scale [1…9] that is based on psychological theories and experiments that points to the use of nine unit scales as a reasonable set that allows humans to perform discrimination between preferences for two items. Each value of the scale can be given a different interpretation allowing a numerical, verbal or graphical interpretation of the values (Saaty 1987).
The prioritization of variants sub-process is useful for selecting which variant the system must adopt at runtime when more than one is variant is enabled at the same time. The variant that will be executed is the one that mostly contributes for the satisfaction of the most critical NFR from the point of view of the software engineer. It should be noted that AHP analysis can be performed using a spreadsheet tool, which shows that there is no need for sophisticated tool support for this method.
The AHP method has many benefits (Brito et al. 2007): it is a well-known and accepted method; it is appropriate for handling conflicting concerns problems; it has the ability to quantify subjective judgements; it is capable of comparing alternatives in relation to established criteria; and it provides means to guarantee the logical consistency of the judgements. Hence, the AHP has proven to be an effective method for prioritizing objectives. In industrial projects, this method has been reported as being effective, accurate and also to yield informative and trustworthy results (Karlsson 1996). However, since all unique pairs must be compared, the required effort can be substantial.
An experiment to study the scalability of statechart generation algorithm was previously conducted by (Pimentel et al. 2014). The inputs of the simulation were five flow expressions with all possible operators and different number of elements (100, 300, 500, 700, and 900). The results demonstrated that the automatic derivation of statecharts from design goal models is feasible even for large models.
Besides, the contextual design goal model captures the inherent variability of the design space, through the definition of alternative refinements for the same design element. Thus, different solutions (statecharts) for a given problem can be devised.
The design of context-sensitive systems entails more work in comparison to applications that do not consider context since they must care for context-related tasks, such as the acquisition, processing, storage and presentation of contextual information. Hence, it is important to note that the monitoring required to assess the context may have a significant impact on the system under development. The context monitoring often consumes many application resources and has the tendency to decrease the system’s performance. Thus, the impact of monitoring the context data must also be taken in consideration when defining the context annotations.
We conducted a controlled experiment to evaluate our process. The subjects were students of different course types (graduate and undergraduate students) having the mostly studied/is studying computer science course. The subjects in our experiment stated that they had previously modeled the behavior of systems (see Fig. 24). Moreover, they had more experience with use case diagram and class diagram. Besides, the majority of the subjects agreed that they have proficiency in modeling languages.
We provided the same training about goal models and statecharts with the same instructor and for the same amount of time (excluding the time for the training about GO2S) for the subjects of both groups. Besides, we asked the subjects to work on the same exercise about a news website individually. We marked the exercise aiming to identify different levels of knowledge about statechart and we performed an oral argumentation about these exercise. We conclude that, although the subjects made some different mistakes, they learned the concepts of the statecharts language, how to apply them and they answered our questions showing confidence. This argumentation provided some evidence that all subjects were at the same level of experience.
We provided a detailed description of the experiment since its design is also a contribution of this paper. It can be used by another researchers in order to perform experiments aiming the replication in future studies with larger samples or different subjects from the industry. It is important to highlight that the experiment was used as a pilot to get some evidence of the feasibility of our process.
From the statecharts produced by the subjects, we can conclude in relation to the syntactic correctness, the number of syntactic errors of control group was higher than the number of process group. The number of warnings, on the other hand, is higher in process group. Considering the completeness of functionalities, we noticed that the number of functionalities in statecharts that behave as described in requirements specification is higher in the process group.
We could also observe that the number of syntactic errors of control group was 66.67 % higher than the number of process group. The number of warnings, on the other hand, was 64.29 % higher in process group.
Moreover, the structural complexity of control group is higher (mean of 68 elements) than process group (62.33 elements) corresponding to a reduction of 8.33 %. In addition, the mean of behavioral similarity of process group was higher (75.56 %) than control group (54.07 %) corresponding to a difference of 21.49 %. Besides, the time spent by the process group to construct the statecharts was higher (119.67 min) than the control group (108.56 min) with a difference of 11 min (9.28 %).
Thereby, the experiment results showed that, with a confidence level of 95 %, that the number of requirements that behave as described in the specification of the experimental groups is higher than the number of control group.
Moreover, the structural complexity was lower in the process group models and the time spent to implement was higher in the process group. The non-rejection of other hypotheses means that it is necessary to conduct more experiments with larger samples sizes in order to be able to confirm or reject such hypotheses with high statistical power.
The nine subjects that applied our process also filled out a post-questionnaire in which they expressed their opinion about the process using the following scale Totally Disagree, Disagree, Indifferent, Agree and Totally Agree. We asked their opinion about easiness to apply the process and six subjects (66.67 %) agreed that the process was easy to use, while 3 subjects (33.33 %) said they Totally Agree.
Eight subjects (88.89 %) agreed that the Activity 1 (Construction of design goal model) is easy and only one subject disagreed (11.11 %) as illustrated in Table 22. Considering the easiness of understanding Activity 2 (Specification of contextual variation points), three subjects (33.33 %) disagreed, two subjects (22.22 %) marked indifferent, and four agreed (44.44 %) as shown in Table 22. In relation to the easiness of Activity 3 (Specification of monitoring and adaptation), three subjects agreed (33.33 %), two subject marked indifferent (22.22 %), three disagreed (33.33 %) and one totally disagreed (11.11 %) as demonstrated in Table 22.
The Activity 4 (Specification of flow expressions) was also evaluated about its easiness of understanding (see Table 22). The majority agreed (55.56 %) and totally agreed (33.33 %) that this activity was easy of understand. Only one subject marked as indifferent (11.11 %). We also asked the subjects if the Activity 5 (Statechart derivation and refinement) was easy to understand. Six subjects (66.67 %) agreed that the activity 5 was easy, one totally agreed (11.11 %), one marked indifferent (11.11 %) and one subject did not answered this question (11.11 %) as illustrated in Table 22.
Therefore, since the subjects did not have much difficulties to use the GO2S process, the results of the experiment indicate that it is possible to reproduce the process and it is understandable. Although the results are limited by the narrow scope we have, we believe that the process and the study design are considerable contributions. This controlled experiment can guide other studies in order to evaluate the GO2S process with more general and conclusive results and can also support other kind of studies.
Nevertheless, despite the encouraging results obtained, they must be considered as preliminaries. Further replication is necessary and also new experiments must be carried out with software engineers who develop context-sensitive systems.
5.1 Contributions
The main contributions of this work consist in the proposal of:
-
A systematic process for deriving the behavior of context-sensitive systems, expressed as statechart, from requirements models, specified as goal models. The GO2S process consists of six sub-processes to guide the software engineer: Construction of design goal model; Specification of contextual variation points; Specification of monitoring and adaptation; Specification of flow expressions, Statechart derivation and refinement. The process was modeled using the BPMN language to capture the sequence of activities to be performed indicating the input/output artifacts. The process is useful both for guiding a context-sensitive systems development team on designing a new application and also as a conceptual foundation to support academic teaching activities on context and context-sensitive systems. This GO2S process for deriving the behavior of context-sensitive systems from requirements models is original.
-
Specification of monitoring and adaptation tasks in a contextual design goal model. We propose the specification of monitoring and adaptation tasks in a single model, the contextual goal model. This is an important contribution since context-sensitive systems should provide three characteristics: monitoring, awareness and adaptation. Therefore, it does not require any additional notation or extension, the specification is performed using the elements already defined in this model.
-
The behavioral contextual design goal model. This model allows to express, in a single model, information about requirements, architectural design, operationalization of NFRs, context, behavior, adaptation and monitoring tasks.
-
A running example to demonstrate the process application. In order to illustrate our process we considered the well-known meeting scheduler system, aiming closely follow the defined process.
-
A controlled experiment in order to evaluate our process. The experiment results allowed us to reject hypotheses that there is no difference between using or not the proposed process. The results of the experiment indicate that there are some evidence that the number of functionalities that behaved as specified in requirements document was higher in the group that used the GO2S process. Besides, the structural complexity was lower. However, the time spent to implement, on the other hand, was slightly higher in the group that followed our approach.
In the next section, we discuss some related works.
6 Related works
To the best of our knowledge, no process regarding the statecharts derivation of context-sensitive systems from goals models has been undertaken so far. However, we identified some works that are somehow related with behavior derivation.
A process for generating complementary design views from a goal model with high variability in configurations, behavioral specifications, architectural and business processes is presented in (Yu et al. 2008). To this end, the authors employed three complementary design views: a feature model, a statechart and a component model. The process is guided by heuristic rules and patterns to map a goal hierarchy into an isomorphic state hierarchy in a statechart. However, the resulting statecharts of this approach do not support the specification of monitoring and adaptation tasks and the variants prioritization as supported in our work. The specification of these tasks are necessary in the development of context-sensitive systems since they must have three characteristics: monitoring, awareness and adaptation (Klein et al. 2008).
The STREAM-A (Strategy for Transition between Requirements and Architectural Models for Adaptive systems) approach (Pimentel et al. 2012) uses goal models based on i* (istar) framework to support the design and evolution of systems that require adaptability. It comprises the enrichment of the requirements model with contextual annotations and the identification of the data that the system will have to monitor. However, it focuses only on the structure of a system architecture not the behavior. It is of paramount importance to specify and analyze the intended behavior of context-sensitive systems before they are fully implemented since context acts like a set of constraints that influence the behavior of a system (a user or a computer) embedded in a given task (Bazire and Brézillon 2005). The behavioral specification is used as input to the analysis which explores the range of possible order of interactions, opportunities for concurrency, and time-based interaction dependencies among system elements. Hence, an important difference of our work is to specify and analyze the intended behavior of these systems.
In a subsequent work, (Pimentel et al. 2014) proposed a process for deriving behavioral models from goal models. The behavioral models, expressed as statecharts, are obtained through a series of refinements expressed within an extended design goal model that constitutes an intermediary model between requirements and architecture. However, they assume that there is an uniform nature of the context in which the system operates. Unfortunately, this is not always the case. This assumption is not valid in many types of systems, where it is essential to monitor and adapt to an inherently varying context in order to keep the system’s goals satisfied. We consider the algorithm for the statecharts derivation developed in this work and adapt it to CSS. Besides considering the modeling of system’s context, the monitoring and adaptation tasks, we address the operationalization of NFRs. Moreover, given that it is possible that several variants may be enabled in certain contexts, it is necessary to determine the best option. Hence, we propose to perform this prioritization through the contribution of the variants to the satisfaction of the non-functional requirements.
An integrated approach to assist the design of context-sensitive systems is described in (Vieira et al. 2011). Their work includes a context metamodel for representing structural and behavioral aspects on CSS. In order to support the modeling of behavioral concepts, the authors propose the use of a Unified Modeling Laguage (UML) profile to model the application behavior using the UML activity diagram with the semantics defined in the Contextual Graphs (CxG)(Brézillon 2007). However, the authors observed in their empirical study that the usage of UML Activity diagram to model the contextual graphs following the CxG profile, caused misunderstandings, since the semantics of the elements of this diagram conflicted with the contextual graph elements semantics. In our work, we use the statecharts to specify the intended behavior of context-sensitive systems since it is a popular choice for representing the behavioral view of a system and it is also adopted by UML language. Besides, this notation is an interesting visual formalism for modeling context-sensitive systems since they are reactive and adapt their requirements. Moreover, an activity diagram is a special case of a statechart. Statecharts, otherwise, are a powerful graphical notation to describe reactive systems that allow nested super- /sub-state structure for abstraction or decomposition. This hierarchical notation of statecharts allows the description of the behavior of context-sensitive systems at different levels of abstraction. This property of statecharts makes them much more concise and usable than activity diagrams and contributes to a lower structural complexity of the models. Besides, we also concerned with the satisfaction of NFRs, thus we propose an activity in our process that deals with variants prioritization.
The contextual goals models were used in two scenarios of systems operating in and reflecting varying contexts in the work of (Ali 2010). They organized two lab sessions and invited a group of requirements analysts to apply their framework. The analysts have modeled the requirements of the two systems, smart home and museum-guide, using the contextual goal model. The requirements analysts, who participated in the sessions, have already a good expertise in goal modeling and they are familiar with emerging computing paradigms scenarios such as ubiquitous computing and mobile information systems. The results of the study conducted by (Ali 2010) showed that the contextual goal model is easy to understand; the framework provides a useful systematic way to analyze contexts; the relation between goals and context is strong in certain systems; the context specification could be a subject to viewpoints (in some other cases, it was debatable if a certain context is a statement or a fact).
The use of flow expressions to specify the behavior of systems has been presenting promising results. This notation has been accepted and used successfully used in many works (Pimentel et al. 2014; Shaw 1978; Dalpiaz et al. 2013) since it is a notation with reasonable complexity but is easy to use. The specification of the system behavior through flow expressions was proposed in the work of (Shaw 1978). This work defines the flow expressions language, for describing flows in sequential and concurrent software, and illustrates its use in a variety of applications. According to the authors, this notation provides another tool for software design, analysis, and understanding.
As evidence of the notation usefulness, (Shaw 1978) exhibited the application of flow expressions in many areas including the modeling of concurrent programs, the description of operating system architectures, the specification of synchronization problems and solutions, the flow and description of command languages, and systems analysis. We used this notation in the GO2S process to specify the behavior of context-sensitive systems and to derive contextualized statecharts.
The work of (Pimentel et al. 2014) explores the flow expressions in their multi-dimensional approach that exploits inherent variability of the design space. In this work, alternative refinements are considered for the same intermediate problem, resulting in multiple solutions (statecharts) from a single initial problem (requirements). The flow expressions are also used in the work of (Dalpiaz et al. 2013) to propose a conceptual distinction between Design-time Goal Models (DGMs) - used to design a system - and Runtime Goal Models (RGMs) - used to analyze a system’s runtime behavior with respect to its requirements. In their work, RGMs extend DGMs with additional state, flow expressions and historical information about the fulfilment of goals.
7 Conclusion
In this work, we proposed a systematic process for deriving the behavior of context-sensitive systems, expressed as statechart, from goal models namely GO2S. The process consists of six sub-processes to guide the analyst.
The first sub-process concerns the construction of a design goal model. It is followed by the definition of contextual variation points. In the third sub-process, the tasks required for the monitoring and adaptation activities are specified. Later, the system behavior is represented in flow expressions in the fourth sub-process. The next one derives a statechart from the behavioral contextual design goal model. Finally, the last sub-process is the prioritization of variants.
We conducted a controlled experiment in order to evaluate our process. The experiment results allow us to reject hypotheses that there is no difference between using or not the Go2S process. Besides, that are some evidence that the Go2S process can improve the number of functionalities implemented as specified in requirements document with lower structural complexity. Moreover, the results also indicate that it is possible to reproduce the process and it is understandable.
7.1 Future works
For future works, the following activities can be undertaken:
-
Develop a case tool to implement the process. This tool could be used to produce the goal model and guide the software engineer to apply the GO2S process generating the different views (design, contextual and behavioral) of our process to implement the statechart derivation.
-
Apply the process to complex systems. The use of the process for more complex systems, especially in the context of the industry, would help to assess if it is suitable in different domains. Equally important is to conduct further investigation to assess its costs and benefits. This analysis would help to identify points of the process that require improvements.
-
Formally define the dependent variables. A rigorous formalization of the dependent variables, especially the behavioral similarity, is another work that can contribute to facilitate the evaluation of each subject’s response as right or wrong or in-between.
-
Perform new controlled experiments. Despite the encouraging results obtained, we consider them as preliminaries. Further replication is necessary and also new experiments must be carried out with software engineers who develop context-sensitive systems.
-
Develop mechanisms to perform the reasoning of context-sensitive systems from the generated statecharts. Statecharts allow the reasoning through the analysis of properties such as system’s completeness and correctness. This reasoning could be added to the GO2S process to improve the quality of generated statecharts.
-
Incorporate other architectural views in our process. Software architecture can be composed of four views: structural, behavioral, deployment, and configuration. The structural view was already addressed in the work of (Pimentel et al. 2012) and our process addressed the behavioral view. It is important to derive systematically the other architectural views, for example deployment and configuration in order to obtain a complete system specification.
-
Investigate the use of ontologies in the process. The use of ontologies can contribute to perform the verification of behavioral models considering their empirical benefits for requirements engineering identified in a previous systematic literature review (Dermeval et al. 2015).
References
Abowd, GD, Dey AK, Brown PJ, Davies N, Smith M, Steggles P (1999) Towards a better understanding of context and context-awareness. In: Gellersen H-W (ed)Handheld and Ubiquitous Computing. Lecture Notes in Computer Science, 304–307.. Springer.
Ali, R (2010) Modeling and reasoning about contextual requirements: Goal-based framework. PhD thesis, Universita degli Studi di Trento.
Ali, R, Dalpiaz F, Giorgini P (2010) A goal-based framework for contextual requirements modeling and analysis. Requirements Eng 15(4): 439–458.
Angelopoulos, K, Souza VES, Mylopoulos J (2014) Dealing with multiple failures in zanshin: a control-theoretic approach In: Proceedings of the 9th International Symposium on Software Engineering for Adaptive and Self-Managing Systems. SEAMS 2014, 165–174.. ACM, New York, NY, USA.
Basili, VR, Selby RW, Hutchens DH (1986) Experimentation in software engineering. IEEE Trans Softw Eng SE 12(7): 733–743.
Bazire, M, Brézillon P (2005) Understanding context before using it. In: Dey A, Kokinov B, Leake D, Turner R (eds)Modeling and Using Context. Lecture Notes in Computer Science, 29–40.. Springer.
Brézillon, P (2007) Context modeling: Task model and practice model In: Modeling and Using Context, 122–135.. Springer.
Brito, IS, Vieira F, Moreira A, Ribeiro RA (2007) Handling Conflicts in Aspectual Requirements Compositions. In: Rashid A Aksit M (eds)Transactions on Aspect-Oriented Software Development III, 144–166.. Springer Berlin Heidelberg, doi:10.1007/978-3-540-75162-5_6.
Carver, JC, Jaccheri L, Morasca S, Shull F (2010) A checklist for integrating student empirical studies with research and teaching goals. Empir Softw Eng 15(1): 35–59.
Castro, J, Kolp M, Mylopoulos J (2002) Towards requirements-driven information systems engineering: the tropos project. Inform Syst 27(6): 365–389.
Chalmers, D (2002) Contextual mediation to support ubiquitous computing. PhD thesis, University of London, Imperial College of Science, Technology and Medicine.
Chung, L, Nixon BA, Yu E, Mylopoulos J (2012) Non-functional requirements in software engineering, Vol. 5. Springer Science & Business Media.
Clements, P, Garlan D, Bass L, Stafford J, Nord R, Ivers J, Little R (2002) Documenting Software Architectures: Views and Beyond. Pearson Education, United States.
Dalpiaz, F, Borgida A, Horkoff J, Mylopoulos J (2013) Runtime goal models: Keynote In: Research Challenges in Information Science (RCIS), 2013 IEEE Seventh International Conference On, 1–11.. IEEE.
Dermeval, D, Vilela J, Bittencourt II, Castro J, Isotani S, Brito P, Silva A (2015) Applications of ontologies in requirements engineering: a systematic review of the literature. Requirements Engineering. Springer, pp 1–33.
Dijkman, R, Dumas M, van Dongen B, Käärik R, Mendling J (2011) Similarity of business process models: Metrics and evaluation. Inf Syst 36(2): 498–516.
Fenton, N (1993) How effective are software engineering methods?J Syst Softw 22(2): 141–146.
Harel, D (1987) Statecharts: A visual formalism for complex systems. Sci Comput Program 8(3): 231–274.
Hatcliff, J, Wassyng A, Kelly T, Comar C, Jones P (2014) Certifiably safe software-dependent systems: challenges and directions In: Proceedings of the on Future of Software Engineering, 182–200.. ACM.
Karlsson, J (1996) Software requirements prioritizing In: Proceedings of the Second International Conference on Requirements Engineering, 110–116.. IEEE.
Klein, C, Schmid R, Leuxner C, Sitou W, Spanfelner B (2008) A survey of context adaptation in autonomic computing In: Fourth International Conference on Autonomic and Autonomous Systems, 2008. ICAS 2008, 106–111.. IEEE.
Lapouchnian, A (2005) Goal-oriented requirements engineering: An overview of the current research. Technical Report. University of Toronto.
Liu, Y, Ma Z, Shao W (2010) Integrating non-functional requirement modeling into model driven development method In: Software Engineering Conference (APSEC), 2010 17th Asia Pacific, 98–107.. IEEE.
Mellor, SJ, Clark T, Futagami T (2003) Model-driven development: guest editors’ introduction. IEEE Softw 20(5): 14–18.
Miranda, D, Genero M, Piattini M (2005) Empirical validation of metrics for uml statechart diagrams In: Enterprise Information Systems V, 101–108.. Springer, Netherlands.
Morandini, M, Migeon F, Gleizes M-P, Maurel C, Penserini L, Perini A (2009) A goal-oriented approach for modelling self-organising MAS In: Engineering Societies in the Agents World X, vol 5881, 33–48.. Springer,
Murata, T (1989) Petri nets: Properties, analysis and applications. Proc IEEE 77(4): 541–580.
Nicola, Rd (1987) Extensional equivalences for transition systems. Acta Informatica 24(2): 211–237.
Nuseibeh, B (2001) Weaving together requirements and architectures. Computer 34(3): 115–119.
OMG (2016) Object Management Group. Business Process Model and Notation. http://www.bpmn.org/. Accessed 17 Dec 2014.
Penserini, L, Perini A, Susi A, Mylopoulos J (2007) High variability design for software agents: Extending tropos. ACM Trans Autonomous Adaptive Syst (TAAS) 2(4): 16:1-16:27.
Pimentel, JHC (2015) Systematic design of adaptive systems — a control-based framework. PhD thesis, Federal University of Pernambuco, Centers of Informatics.
Pimentel, J, Lucena M, Castro J, Silva C, Santos E, Alencar F (2012) Deriving software architectural models from requirements models for adaptive systems: the stream-a approach. Requirements Eng 17(4): 259–281.
Pimentel, J, Castro J, Mylopoulos J, Angelopoulos K, Souza VES (2014) From requirements to statecharts via design refinement In: Proceedings of the 29th Annual ACM Symposium on Applied Computing: 24–28 March 2014; Gyeongju, Korea, 995–1000.. ACM.
Ranjita, KS, Prafulla KB, Durga PM (2012) Minimal testcase generation for object-oriented software with state charts. arXiv preprint arXiv:1208.2265.
Runeson, P (2003) Using students as experiment subjects–an analysis on graduate and freshmen student data In: Proceedings of the 7th International Conference on Empirical Assessment in Software Engineering.–Keele University, UK, 95–102.. Citeseer.
Saaty, RW (1987) The analytic hierarchy process - what it is and how it is used. Mathematical Modelling 9(3): 161–176.
Santos, VVd (2008) Cemantika: A domain-independent framework for designing context-sensitive systems. PhD thesis, Universidade Federal de Pernambuco, Centro de Informática.
Santos, EB (2013) Business process configuration with nfrs and context-awareness. PhD thesis, Federal University of Pernambuco, Centers of Informatics.
Shaw, AC (1978) Software descriptions with flow expressions. Softw Eng IEEE Trans3: 242–254.
Sjoberg, DIK, Anda B, Arisholm E, Dyba T, Jorgensen M, Karahasanovic A, Koren EF, Vokac M (2002) Conducting realistic experiments in software engineering In: Proceedings of 2002 International Symposium in Empirical Software Engineering, 17–26.
Sommerville, I, Kotonya G (1998) Requirements Engineering: Processes and Techniques. John Wiley & Sons, Inc., New York, NY, USA.
Svahnberg, M, Aurum A, Wohlin C (2008) Using students as subjects - an empirical evaluation In: Proceedings of the Second ACM-IEEE International Symposium on Empirical Software Engineering and Measurement. ESEM ’08, 288–290.. ACM, New York, NY, USA.
Van Lamsweerde, A, Darimont R, Massonet P (1995) Goal-directed elaboration of requirements for a meeting scheduler: Problems and lessons learnt In: Requirements Engineering, 1995, Proceedings of the Second IEEE International Symposium On, 194–203.. IEEE.
Vieira, V, Tedesco P, Salgado AC (2011) Designing context-sensitive systems: An integrated approach. Expert Syst Appl 38(2): 1119–1138.
Vinson, NG, Singer J (2008) A practical guide to ethical research involving humans In: Guide to Advanced Empirical Software Engineering, 229–256.
Wohlin, C, Runeson P, Höst M, Ohlsson MC, Regnell B, Wesslén A (2012) Experimentation in Software Engineering. Springer, Norwell, MA, USA.
Yakindu Statechart Tools (2016). http://statecharts.org/. Accessed 17 Dec 2014.
Yu, Y, Lapouchnian A, Liaskos S, Mylopoulos J, Leite JC (2008) From goals to high-variability software design In: Foundations of Intelligent Systems, 1–16.. Springer.
Acknowledgements
The following Brazilian institutions have supported this work: FACEPE, CAPES and CNPq.
Author information
Authors and Affiliations
Corresponding author
Additional information
Competing interests
The authors declare that they have no competing interests.
Authors’ contributions
Every author was important for the completion of this article, however, their previous activities are also important to reach the research results, then, these activities are listed in this section. The activities proposed in our process have been shaped in periodic meetings among JV and JC. All authors planned the experiment protocol and analyzed the threats to the validity of the experiment and the measures to reduce the risks. JV carried out the experiment and analyzed its results assisted by JP and JC. All authors read and approved the final manuscript.
Rights and permissions
Open Access This article is distributed under the terms of the Creative Commons Attribution 4.0 International License (http://creativecommons.org/licenses/by/4.0/), which permits unrestricted use, distribution, and reproduction in any medium, provided you give appropriate credit to the original author(s) and the source, provide a link to the Creative Commons license, and indicate if changes were made.
About this article

Cite this article
Vilela, J., Castro, J. & Pimentel, J. A systematic process for obtaining the behavior of context-sensitive systems. J Softw Eng Res Dev 4, 2 (2016). https://doi.org/10.1186/s40411-016-0028-3
Received:
Accepted:
Published:
DOI: https://doi.org/10.1186/s40411-016-0028-3